
 Bitcoin
 Solana
 Pearl
Pearl Zerebro
 Aerodrome Finance
 LayerZero
 NEAR Protocol
- The FCIT share price is trading at 846 GBX.
- The company stock price is trading at a crucial support level of 839 GBX.
The F&C Investment Trust Plc (LSE: FCIT) is an investment company founded in 1868. The company’s objective is to secure long-term growth in capital and income through an international investment portfolio. The firm manages the company’s investment portfolio.
F&C Investment Trust Plc (FCIT) Stock: Technical Analysis
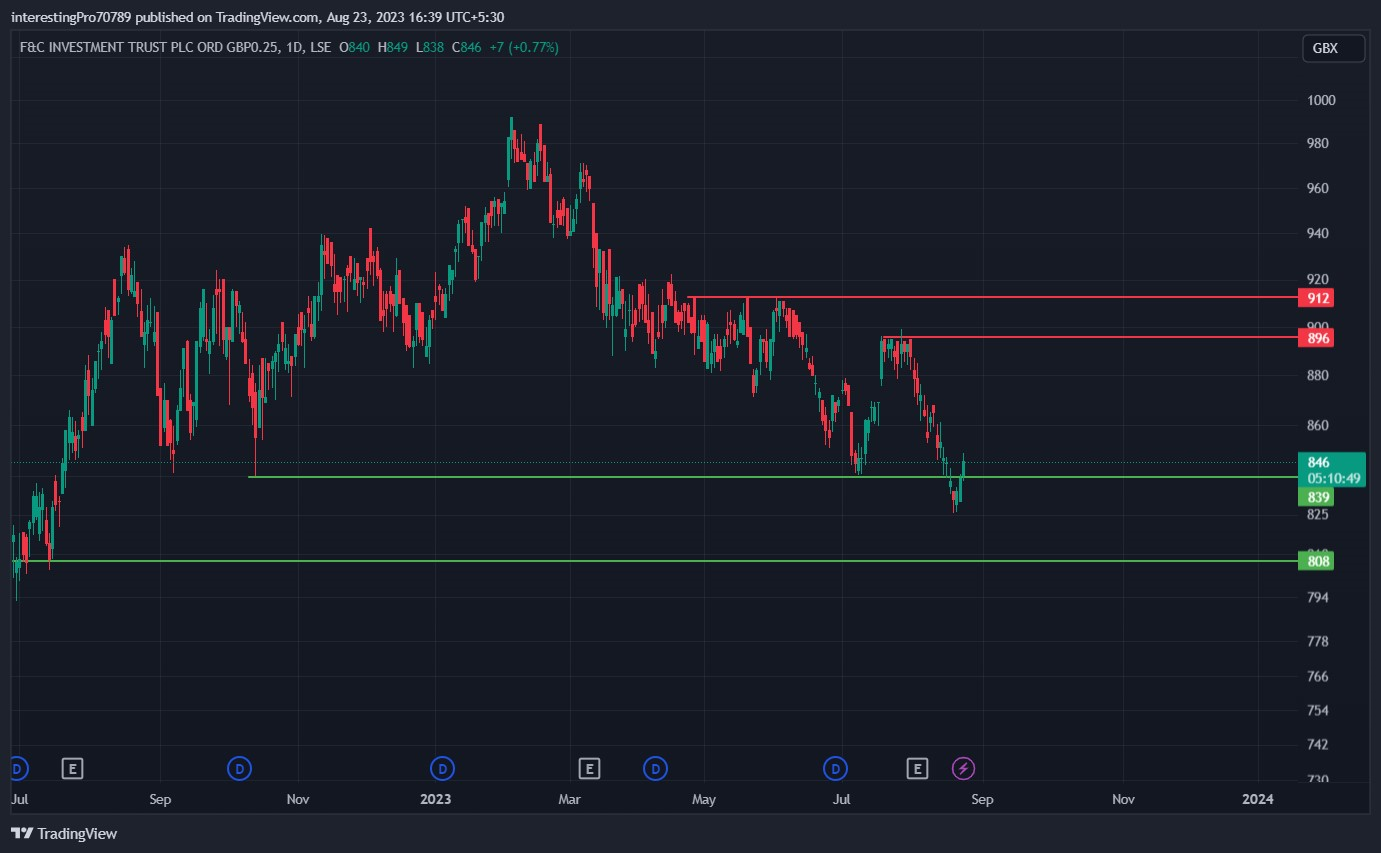
In October 2022, the FCIT price formed support of 839 GBX and commenced a bullish rally. The price after making a 20-week high of 992 GBX the price got exhausted and started to fall.
The price after falling again went down to the 839 GBX support. The buyers again showed their presence at that level and sent the price in the upward direction to 896 GBX. The price after making a new swing came down to 839GBX.
In August 2023, the price after various times trying to close below the 839 GBX finally closed below this level. The price was not able to maintain that breakdown after which the buyers overpowered the sellers and reclaimed the 839 GBX support. Thus the breakdown was turn into a fakeout.
If the buyers show interest at this level like the previous time then the price can be seen breaking the recent swing. Then the price can reach 910 GBX in the future. But the price can’t sustain over the 839 GBC then the price can be seen to its next support at 808 GBX.
Technical Indicators’ Prediction About the Current Trend
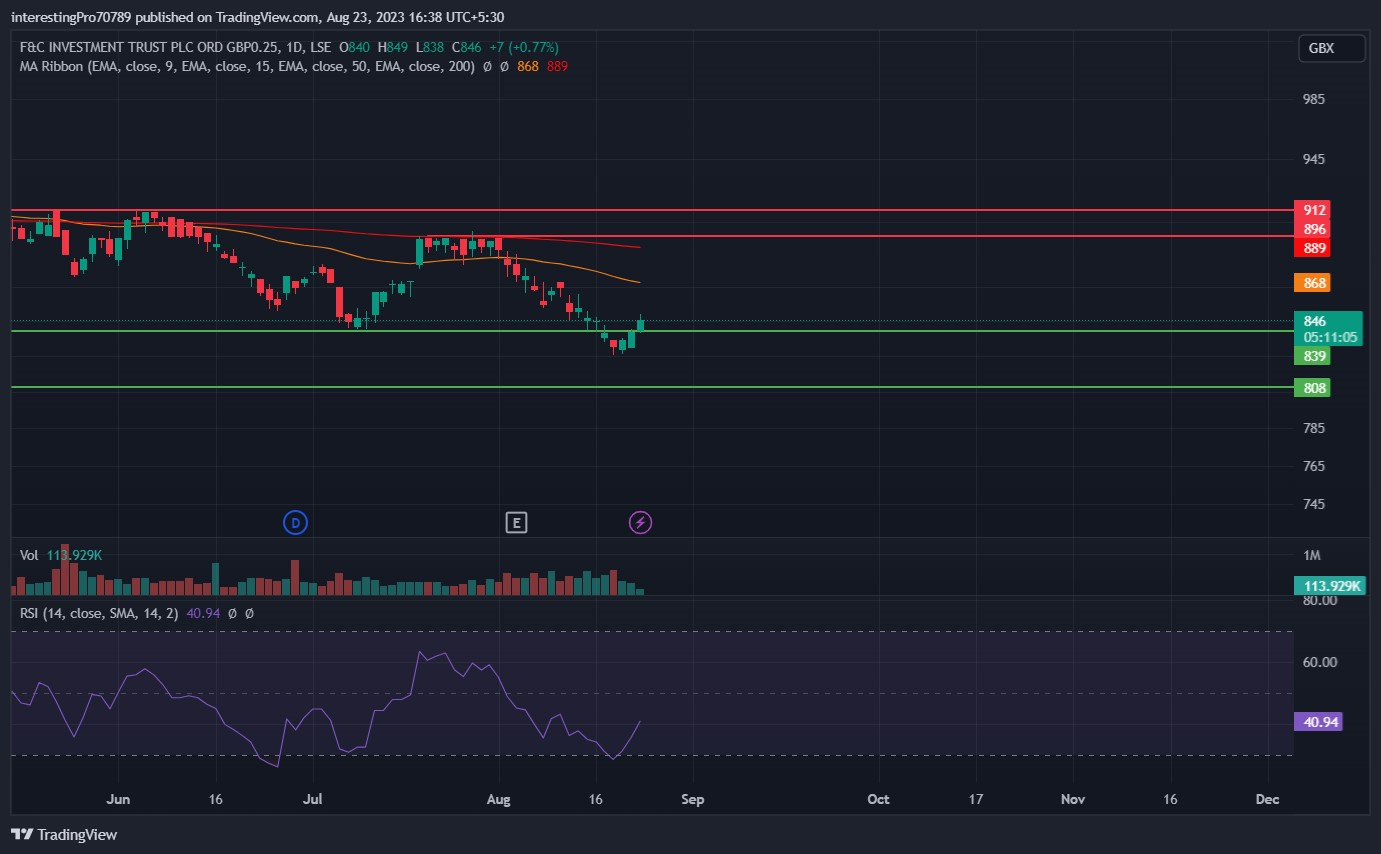
The 50 EMA (yellow line) is at GBX and the 200 EMA (red line) is at GBX. The price of F&C Investment Trust Plc is currently trading below the 50 and 200 EMA. This indicates that the price is in bearish sentiment.
The relative strength index (RSI) is at 40.94. The RSI line is heading towards the 50 RSI level. This indicates that the price is in neutral territory. The RSI line trending in the upward direction the price can be in bullish sentiment shortly if the RSI crosses above the 50 RSI level.
Conclusion
The FCIT chart is in bearish sentiment at the time of writing. FCIT Share Price has reclaimed the 839 GBX support after the breakdown. If the price sustains over this level then the can be see rising in the future. But the buyers failed to sustain the price over 839 GBX. Then the price can be see going down to its next support at 808 GBX. All the indicators mentioned above are bearish or neutral at the time of writing.
Technical levels
Resistance levels: 896 GBX and 912 GBX.
Support levels: 839 GBX and 808 GBX.
Disclaimer
The views and opinions stated by the author, or any people named in this article, are for informational purposes only. They do not establish financial, investment, or other advice. Investing in or trading crypto assets comes with a risk of financial loss.



