
 Altai the Tiger
 Sword Inu
 streamoors
 IGNITION
 NEAR Protocol
 Pearl
Pearl Injective
- The Cigna Group share price is trading at $287.54.
- The stock price has shown signs of the continuation of the bullish rally.
The Cigna Group (NYSE: CI) is a healthcare and insurance company that deals in the provision of global healthcare services.
Cigna Group (CI) Stock: Price Analysis
The CI stock price is trading at $287.54 and has gained 0.51% in the last trading session with a trading volume of 978.609K. The company stock current market capitalization is around 58.106 billion USD.
Signs of Continuation of Bullish Trend In 1-day Chart of CI Stock
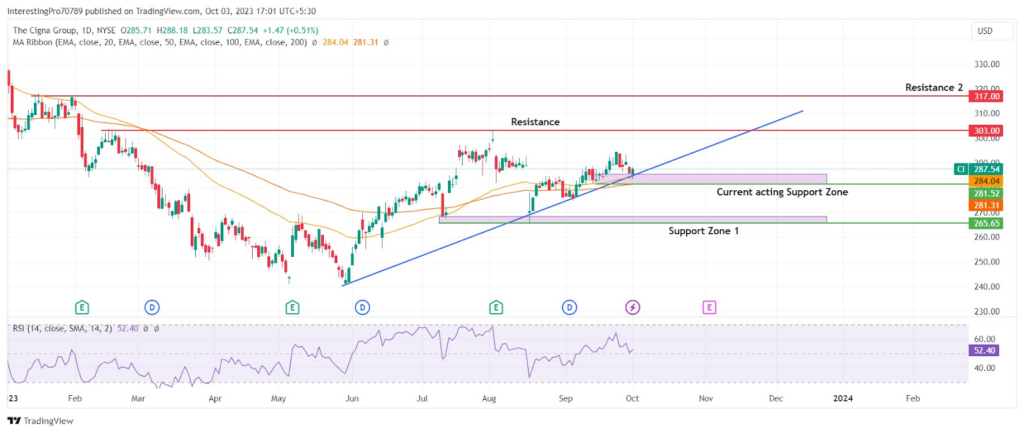
If we observe the 1-day chart, the price has been in an uptrend with support of the trendline. The price has recently filled the gap that was left and is approaching its $303.00 resistance level. Currently, the share price is taking support from the $281.52 support zone and seems to be taking support from the trendline as well.
The 50 and 100 EMA are below the CI share price. The price has also taken the support of 50 EMA. It shows that the CI price is in bullish sentiment and is under the control of the buyers.
The RSI has taken support from the 50 RSI level and has started to slope in the upward direction. That shows the buyers are currently very active in the current scenario. The upward sloping of the RSI also shows that there is more room for buyers on the upside to raise the price in the upward direction.
The CI chart shows that its price is in a bullish trend. The price is currently taking support from the three different supports such as its horizontal support of $281.52, trendline support, and 50 EMA support. The price is approaching its $303.00 resistance. If the CI stock price continues to rise and gives a breakout of the $303.00 resistance, it may rise to its next resistance at $317.00.
However, if the price gives the breakdown of all the support from which it is currently taking support from, then it would fall its support at $265.65 level.
Conclusion
The Cigna Group chart is in bullish sentiment. The price is currently initiating an uptrend with the support of the trendline. Currently, the price is sustaining above the $281.52 level. If the price continues to rise and gives the breakout of the $303.00 resistance and sustains above that, it may rise to its next resistance at $317.00.
However, for the price to be in bearish sentiment it must give the breakdown of the $281.52 level and trendline or close below both the EMA’s. Then it would fall to its support at $265.65
Technical levels
Resistance Levels: $303.00 and $317.00.
Support Levels: $281.52 and $265.65.
Disclaimer
The views and opinions stated by the author or any other person named in this article are for informational purposes only. They do not provide financial, investment, or other advice. Investing in or trading comes with a risk of financial loss.



