
 streamoors
 IGNITION
 NEAR Protocol
 Injective
 Pearl
Pearl LayerZero
 Quantus
- The SNPS stock price is consolidating near the all-time high levels.
- The SNPS stock has surged by over 50% in a year.
- Synopsys Inc.’s Management has appointed Ann Minooka as chief marketing officer.
The current market price of the Synopsis Stock- $457.6
What has happened till now in the Synopsis Stock?
The Synopsis stock price has been consolidating in a range for more than 4 months. The stock is facing strong resistance from the $470 level, where a heavy amount of supply is present. This stock has surged by more than 4% in a week and 1% in a month. It indicates that the price is consolidating positively. However, the stock price has surged by over 50% in a year, which signifies that the price is dominated by the bulls throughout the year.
The Synopsis company has never paid any kind of dividend to its shareholders. The company reported a net cash surplus of $1.15 billion in the previous quarter. It shows that the company’s financial position is strong. Synopsis has reported a net cash surplus in the last 6 years, which indicates that the company is managing their debts amazingly.
The company has reported increased revenue in previous quarters which shows that the company is growing strongly. This firm’s revenue has shown a jump of 19.65% (YOY) in the previous quarter, which is a good sign for the company. If we consider the net income of the company, it has jumped by over 50 % in the last quarter after declining for 3 consecutive quarters.
Is the SNPS price ready to give a breakout of the ascending triangle pattern?
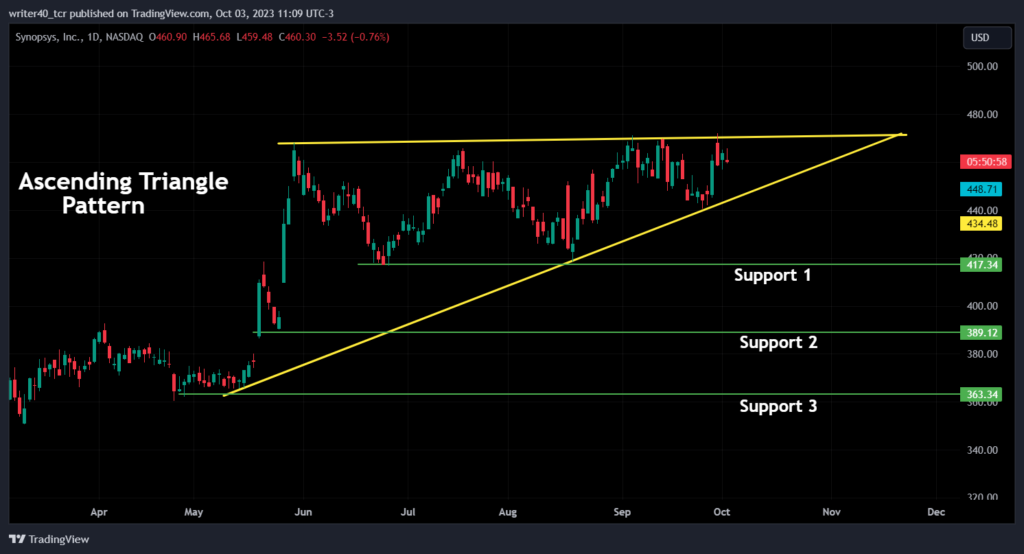
The stock price has formed an ascending triangle pattern and facing strong resistance near the $470 level. The uptrend of this stock has been supported by the rising trendline, which is currently present near the level of $445. This stock has formed some gaps on the chart which is yet to be filled.
If we consider the support levels other than the trendline support, it is marked on the chart. The important support that the price has been holding for 4 months is present at the $417 level, which is marked as support 1. The other 2 supports i.e. support 2 and support 3 are present at $389 and $363 levels.
Exponential Moving Averages
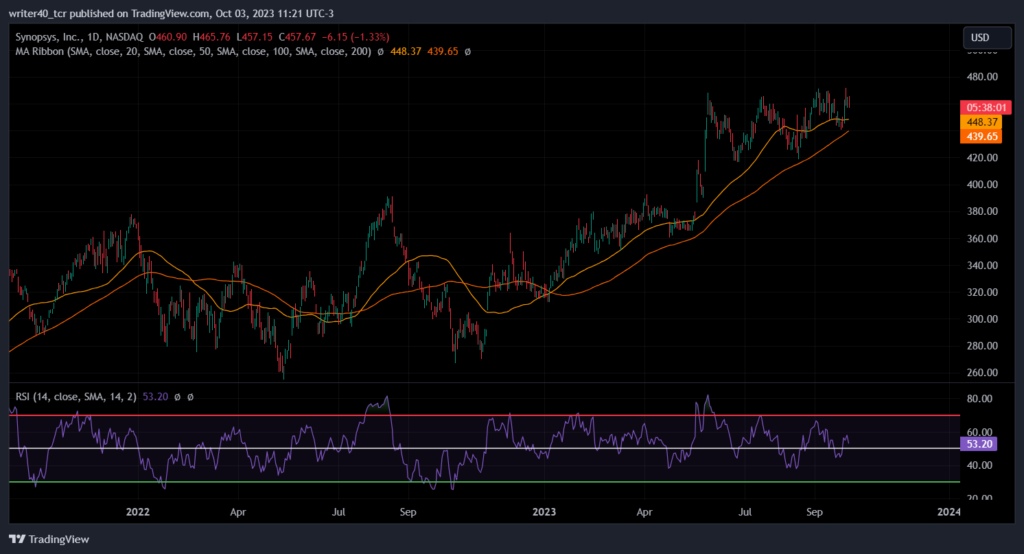
The price is currently trading above the 50-day and 100-day Exponential Moving Averages, which is known as a bullish sign for the price. The EMAs are present at the $448 and $139 levels respectively. The slope of the EMA is upward, which shows that the uptrend is strong.
Relative Strength Index
The Relative Strength Index (RSI) is currently placed well above the 50 level, which indicates that the momentum is favouring bulls. However, the RSI has been roaming in a zigzag motion since the price started the consolidation.
Conclusion
The Synopsys Stock price has been consolidated on the higher side, which indicates that the price is forming a base at the higher level for the next move. If we consider the fundamentals of the company, it is looking strong which can boost the price in future. If the price breaks the upper resistance level, we can witness some good upside, if the price breaks the pattern on the downside, we can expect some fall towards the $417 level.
Technical Level
Resistance – $470
Support – $417 and $389
Disclaimer
The views and opinions stated by the author, or any people named in this article, are for informational purposes only. They do not establish financial, investment, or other advice. Investing in or trading crypto assets comes with a risk of financial loss.



