
 Sword Inu
 no crying in the casino
 streamoors
 IGNITION
 Altai the Tiger
 Pearl
Pearl Quantus
- Technical indicators are trade signals based on historical patterns which help in determining the entry and exit points for traders.
- Oscillators and overlays are the two broad categories of technical indicators.
The core trading principle lies in correctly predicting the price movement and determining the profitable position. Technical indicators are mathematical-based signals or patterns which use historical data to predict future trends. Based on the data, traders decide their exit and entry point in trade and aim to make profits. Often traders use a combination of such indicators which can correctly capture the future price movements along with their personal goals.
Technical indicators are divided into two classes:
Oscillators
These indicators are generally used to identify price turns and reversals in the ranging market because they swing within a predefined range. Their main goal is to give information regarding market momentum and shift. They provide reading for the oversold and the overbought price movements. Their signals oscillate within the local maximum and minimum.
E.g.: Relative strength, MACD, stochastic, etc.
Overlays
These indicators are displayed over the main price chart and use the same scale as in the price chart. They give information on the supply and demand of a stock.
E.g.: Trendline, Bollinger Bands, Support, and Resistance and moving averages.
Some Common Technical Indicators
- Bollinger Bands
They are price envelopes based on standard deviation around the simple moving average of a price. They can easily adapt to the price volatility as the envelope has a bandwidth and upper and lower bands based on standard deviation. They are constructed using the period and standard deviation parameters.
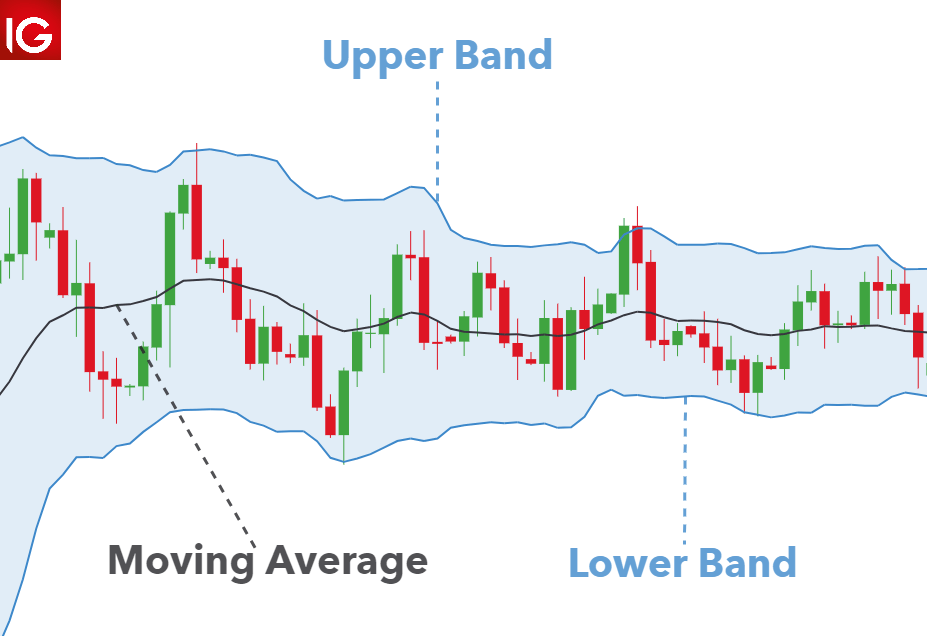
Image 1
Image 1 shows how the price envelope constructed using Bollinger bands surrounds the moving average.
- Relative Strength Index (RSI)
This is used to measure the change and speed of change in price movements. This momentum oscillator swings between 0 and 100, where the RSI > 70, means an overbought condition and where the RSI < 30, means an oversold condition. However, these levels are conventional and a trader may adjust them based on their personal trading pattern.
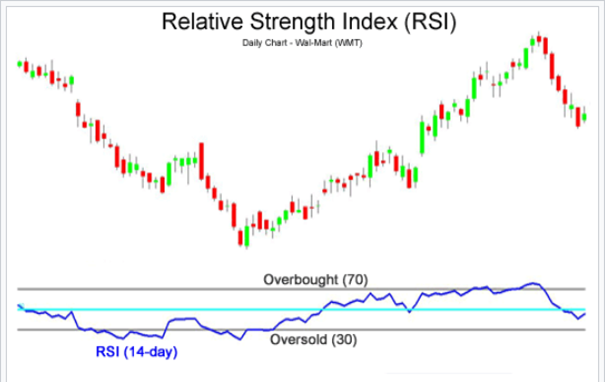
Image 2
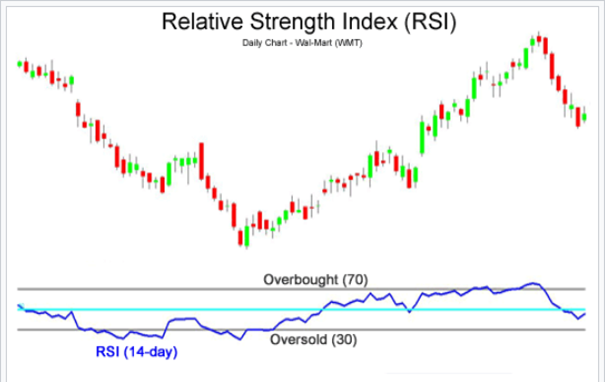
Image 3
Image 2 shows the trend and Image 3 shows its corresponding RSI.
During a bull market, the RSI range of 40-50 acts as a support zone.
During a bear market, the RSI range of 50-60 acts as a resistance zone.
- Moving Average Convergence/Divergence (MACD)
This is a type of momentum oscillator that provides the relation between two exponential moving averages to give trading signals. Long-term EMA (made up of 20 periods) subtracted from Short term EMA (made up of 12 periods), gives MACD.
MACD = Long-term EMA – Short-term EMA
MACD Histogram is the graphical representation of the distance between MACD and the signal line.
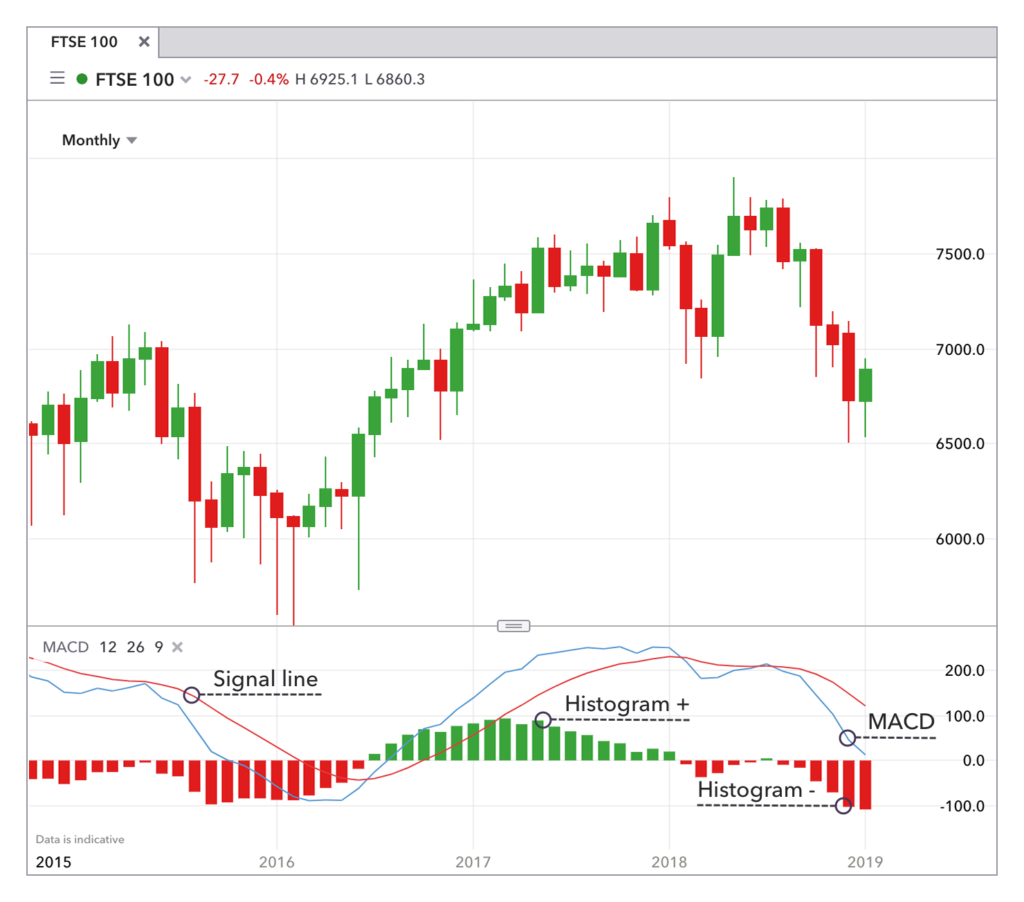
Image 4
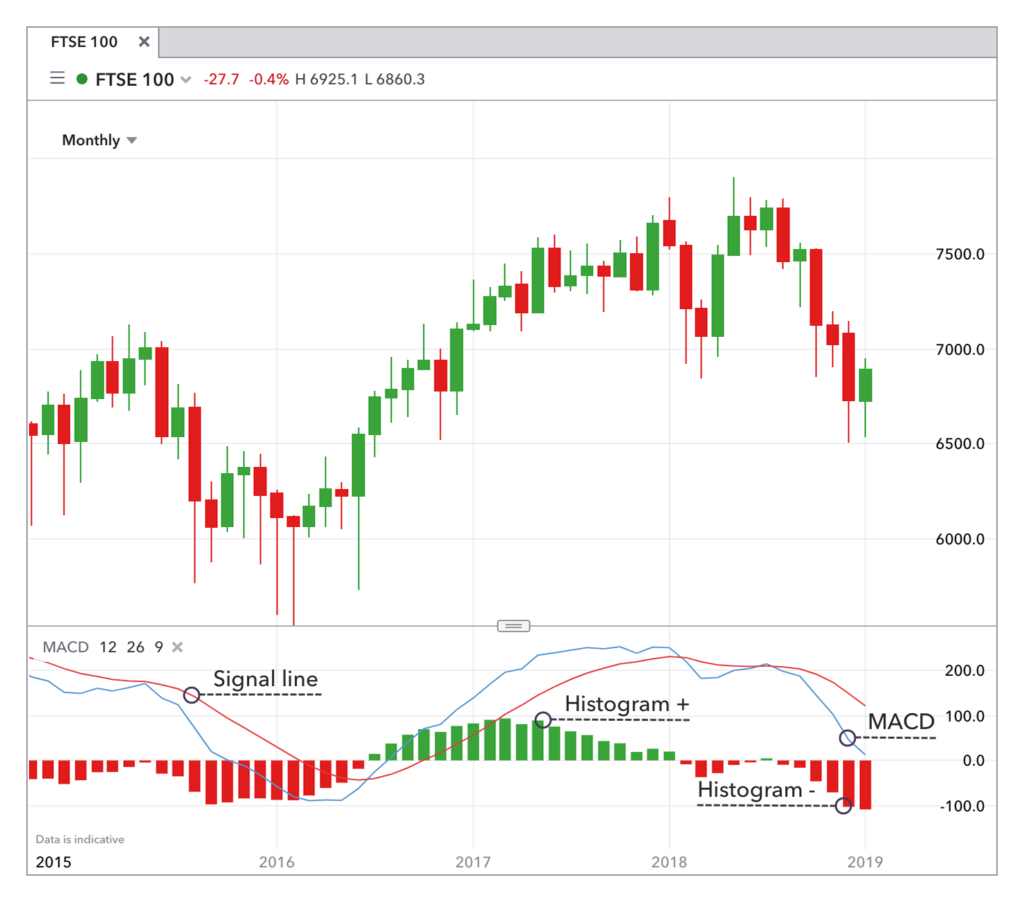
Image 5
Image 4 is a price trend and Image 5 represents the corresponding MACD and MACD Histogram.
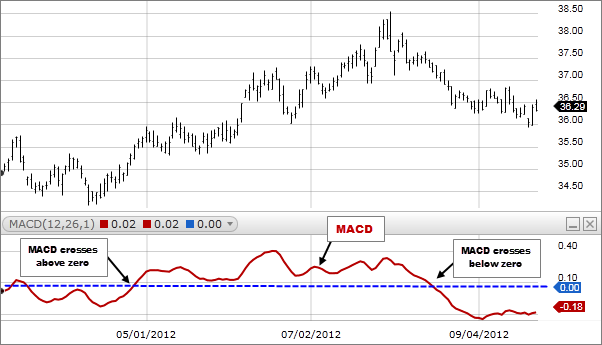
6
By analyzing the indicator, it is observed:
- When MACD is crossing below zero, it is bearish and when the MACD is crossing above zero, it is bullish.
- Concerning the signal line, if the indicator crosses it from below to above, it is bullish, and if from above to below, it is considered a bearish indicator.
- Concerning the zero line, the lower the indicator, the stronger the bullish signal and the upper the indicator, the stronger the bearish signal.
- Stochastic Oscillator
This is a momentum oscillator that helps in comparing the current price to the lowest and highest level of the past. It helps determine price reversals. It swings between 0 and 100, with the range above 80 being an overbought region, while the range below 20 being an oversold region.
However, these are conventional values and a trader may use different regions based on their personal trading patterns.
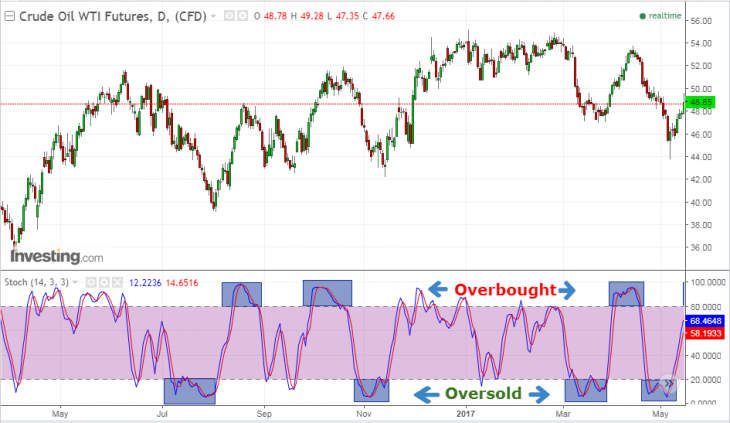
Image 7
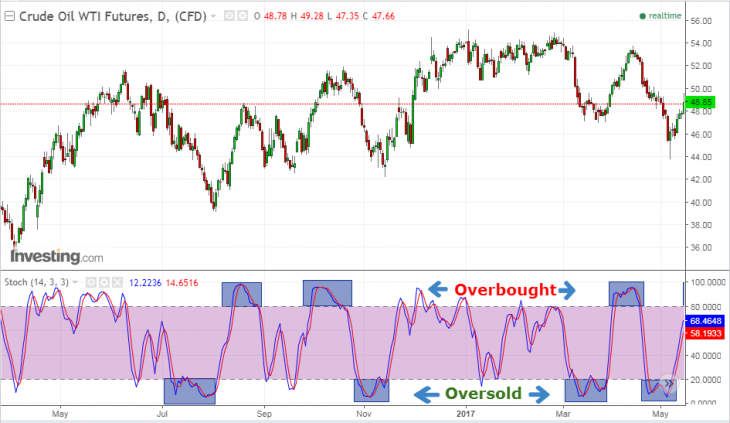
Image 8
Image 7 shows the price pattern and Image 8 represents its corresponding stochastic indicator.
Conclusion
Traders while trading do not rely just on a single indicator but use multiple such indicators together to best predict the future trend. Although these indicators may look easy, it takes practice and experience to fully understand them and become familiar with them. There are hundreds of indicators available, it depends on the trader who clicks with them.




