
 astronaut
 Pearl
Pearl Zylo Ecosystem
 Bitcoin
 Bitway
 NEAR Protocol
 Zcash
Zcash
- The ONDO token price is down by 32% from its all-time high price.
- The Total Value Locked for Ondo Finance has consistently advanced over the last few days.
The Ondo Finance token has strong fundamentals, and the token’s fully diluted market cap (FDMC) is $9.897B. The initial FDMC of the crypto was $550.0M, and the calculated market cap was $1.415B at press time.
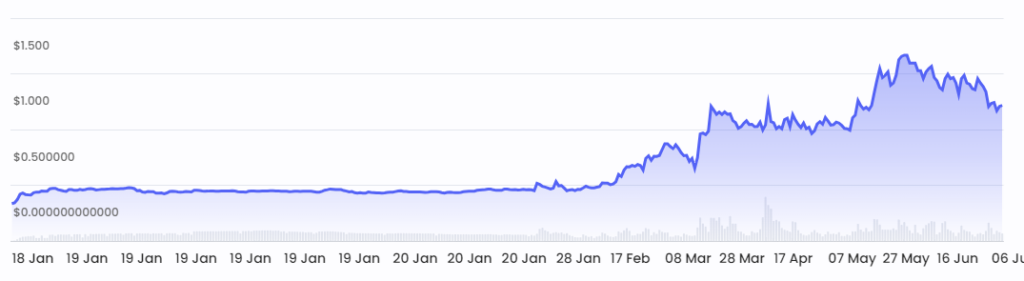
ONDO Price Overview Chart | Source: Chain Broker
The value of the traded volume for the token has witnessed a decline of 7.35% in the last 24 hours, resulting in a traded value of $128.387M. In the seed round, Ondo Finance raised $4.0M, where Pantera Capital was its major investor.
The security score of the token is very strong, resulting in 87.50, representing the strong reliability of the token’s protocol. Certik Skynet gave the security score for the token, which ranked #196.
The token’s market cap has traded flat over the last 24 hours from the press time without any significant change. Also, Ondo Finance is the 56th largest cryptocurrency in the global crypto market, with a market cap dominance of 0.06%.
The price volatility of the ONDO token is certainly high, resulting in 8.86%, while the sentiment is bullish, as per the analysts.
Ondo Finance Derivatives Data Analysis
Despite the decline in the token’s spot trading volume, derivatives trading volume witnessed a surge of 12% in the last 24 hours at press time. This has resulted in a traded value of $233.63M.

Solana Crypto Derivatives Open Interest Chart | Source: Coinglass
The futures open interest curve of the token has been flat over the last few days and has declined over time. This shows no significant rise in the trading activity in the token.
Additionally, the open interest for the token advanced by 4% in the last 24 hours, followed by a higher short liquidation of $91.34K. Against this, the longs liquidated are worth only $50.99K. This shows the presence of buyers in the token.
ONDO Token Technical Analysis
Witnessing profit booking from the higher levels of $1.4840, the price has declined below a crucial trendline.
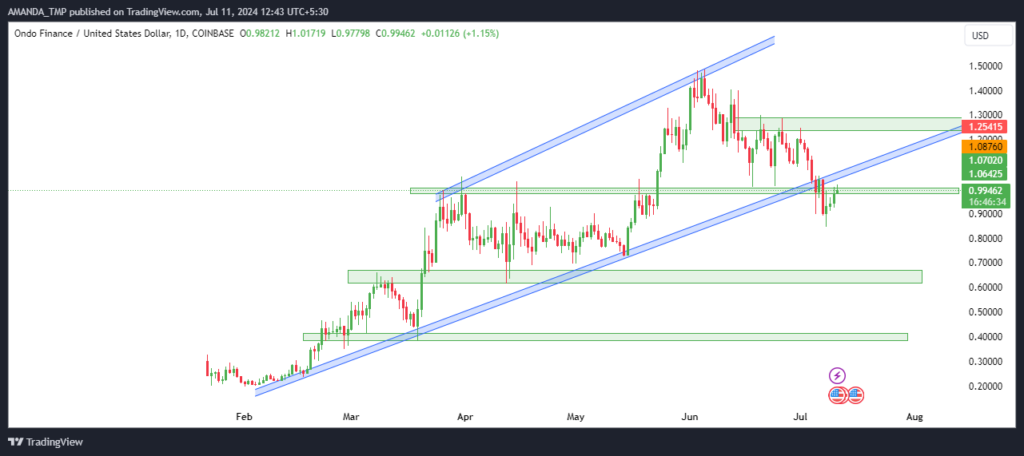
ONDO Crypto Daily Price Chart | Source: TradingView
The price of the ONDO token was trading in an uptrend for a long time, which led to the formation of a rising wedge pattern on the chart. Later, at the beginning of June 2024, a profit booking started. This led to a decline of 35% in the trading price of the token.
The token’s price declined below the rising wedge pattern at press time. If the token’s price further rebounds to the level of $1.3 and sustains above the same, a surge in the crypto price might be witnessed in the future.
ONDO/USD Chart by TradingView
The chart’s 20-day and 50-day EMAs have formed a death cross. The token’s price has also declined below the following EMAs, representing a downtrend in price.
The super trend also gave a bearish signal on the charts, followed by the MACD metrics trading in negative territory. Additionally, the metrics are trading in a bearish cross on the charts.
The RSI also slid below the 50-level and the 14-day SMA by closing below the same. This further represents a weakness in the momentum of the token price.
How the ONDO Token Price May Perform in the Near Future?
The ONDO token price has declined below crucial levels, sparking concerns of a steeper decline.
Despite strong fundamentals and a bullish sentiment, the price has fallen 35% since June 2024. Technical indicators, including a death crossover and bearish signals, suggest potential continued weakness in the token’s price.
The support levels for the ONDO token price are $0.730 and $0.8530, followed by the resistances of $1.280 and $1.50.
Disclaimer
This article is for informational purposes only and does not provide any financial, investment, or other advice. The author or any people mentioned in this article are not responsible for any financial loss that may occur from investing in or trading. Please do your research before making any financial decisions.




