
 streamoors
 Altai the Tiger
 Sword Inu
 IGNITION
 no crying in the casino
 Quantus
 Pearl
Pearl
- A strong surge was recorded in the derivatives trading activity of the Ronin coin.
- The Ronin coin has a strong security score of 83.95, per Certik Skynet.
The token’s volume/market cap ratio has been 2.59%, which showed lower liquidity in the token price.
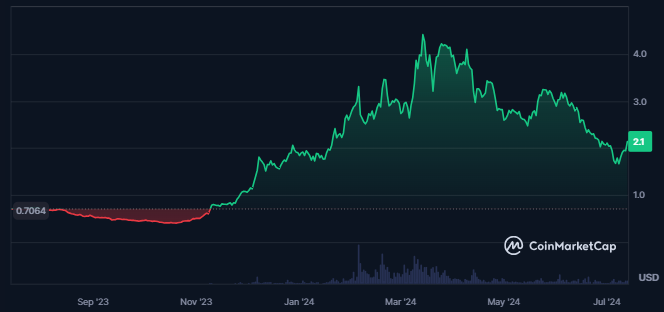
Price Overview Chart of RON | Source: CoinMarketCap
The market cap value of the coin is $721.16M, which has advanced by 13.18% in the last 24 hours from the press time. Additionally, the price of the Ronin coin has advanced by 200% in the last 1 year.
The traded volume for the coin has advanced by 25% in the last 24 hours, resulting in a traded value of $18.651M. Also, the market cap dominance of Ronin crypto is 0.03%, followed by the market cap ranking of the token being #86 as per CoinMarketCap.
The token’s price volatility was also high, resulting in 13.4%, which might lead to uncertain fluctuation in the crypto price. The crypto sentiment is neutral, while the fear and greed index is at 25.
Ronin Coin Derivatives Data Analysis
Higher short liquidations were recorded in the last 24 hours, resulting in a value of $45.68K, while the long liquidations for the coin valued $10.91K. This shows the bulls’ dominance in the crypto over the last 24 hours.

Ronin Crypto Derivatives Volume Chart | Source: Coinglass
The value of the derivatives traded volume for the token further has advanced by 187% in the last 24 hours. This shows a huge surge in the traders activity in derivatives of the coin.
The open interest of the Ronin coin further advanced by 47%, resulting in $6.14M, which showed that a larger number of derivative positions were added for the crypto.
RON Coin Technical Analysis
The price of the RON coin has witnessed a consistent decline from the higher levels for the last five months.
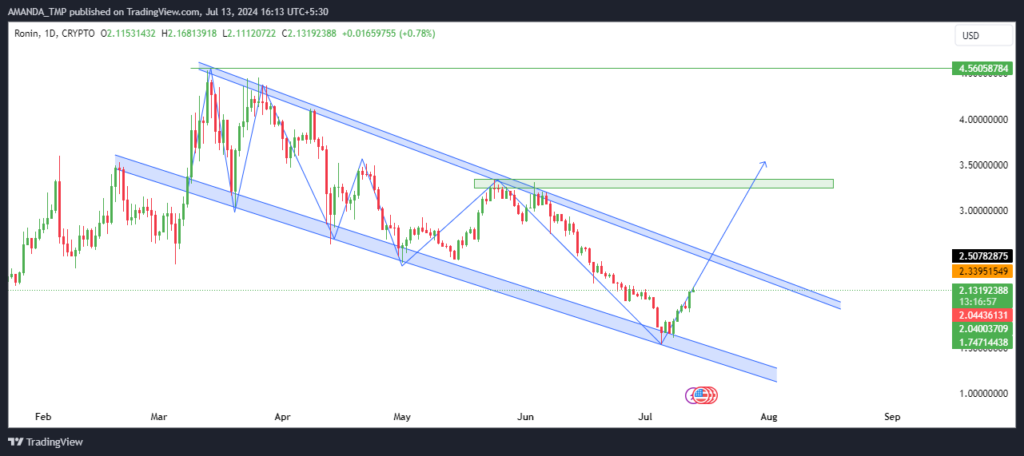
RON Crypto Daily Price Chart | Source: TradingView
The consistent declining behavior of the RON coin price has led to a falling wedge pattern. The coin’s price was trading inside the wedge pattern and hit the pattern’s lower band at press time.
Additionally, the coin’s price has started to witness buying over the last few days, leading to an advance in the crypto price.
RON/USD Chart by TradingView
The RON coin’s price broke above the 20-day EMA while the 50-day and the 200-day EMA traded in a death cross. This represents uncertainty in the token’s price.
The MACD indicator further showed uncertainty in the crypto price as its metrics traded in a golden cross. Despite this, the metrics were trading in the negative trajectory.
The RSI has hit the 50 level at press time, breaking above the 14-day SMA. If the RSI further breaks above the level of 50 and sustains above the same, it might lead to bullish momentum in the crypto price.
Ronin Coin faced high supply Inflation
Despite a strong surge in derivatives trading and a 200% price increase over the past year, the Ronin coin faced high supply inflation and volatility.
The market cap advanced by 13.18%, but with a volume/market cap ratio of 2.59%, liquidity remains low. Technical indicators suggest potential uncertainty and price fluctuations ahead.
The support levels for the RON coin are $0.770 and $1.50, followed by the resistances of $3.30 and $4.560.
Disclaimer
This article is for informational purposes only and does not provide any financial, investment, or other advice. The author or any people mentioned in this article are not responsible for any financial loss that may occur from investing in or trading. Please do your research before making any financial decisions.




