
 Altai the Tiger
 IGNITION
 streamoors
 Sword Inu
 NEAR Protocol
 Injective
 Quantus
- The EOS token’s fear and greed index shows greed among investors.
- The supply inflation of the token is very low (2.81%).
EOS token has 6.253 Million holding addresses, and the top 10 holders of the token have 79.79% of the supply. The number of holding addresses has been constant over the last few weeks.
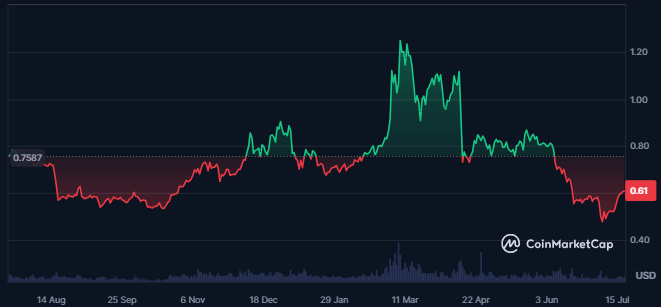
Price Overview Chart of EOS | Source: CoinMarketCap
EOS token’s market cap ranking is #76 per CoinMarketCap, and the token’s market cap value is $916.983 Million. Also, the Total Value Locked in the token is $131.69 Million, and the stablecoin market cap of the token is $72.64 Million.
The sentiment of the token is neutral, while the token’s price is highly volatile (5.80%). Despite this, the market cap dominance of the token is 0.03%, and the fully diluted market cap of the token is $1.281 Billion.
There has been no significant trading activity for the token as the token’s traded value declined 2.62% in the last 24 hours. Additionally, it has resulted in a traded value of $93.44 Million, which shows huge liquidity in the crypto.
EOS Token Derivatives Data Analysis
Although the token broke above significant levels, there is no significant activity in the derivatives of the token.
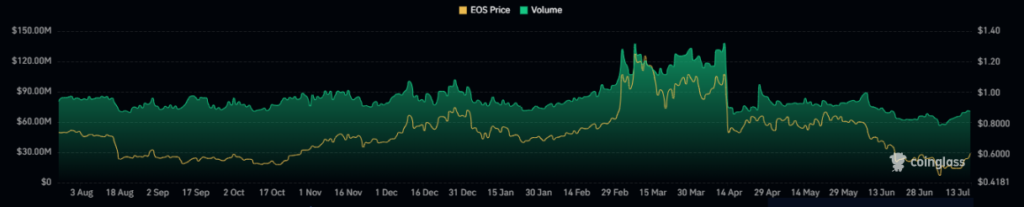
EOS Token Derivatives Liquidation Chart | Source: Coinglass
A surge of 17% was recorded in the derivatives traded volume of the token, resulting in a value of $167.90 Million. Despite this, the open interest has declined 3.9% to $69.99 Million.
The longs liquidated for the token in the last 24 hours are worth $324.77K, against which the liquidated shorts are worth $49.44K reflecting bears’ dominance on the chart.
Technical Analysis
EOS token’s price has broken above strong dynamic resistance levels that the price respected for the last six months.
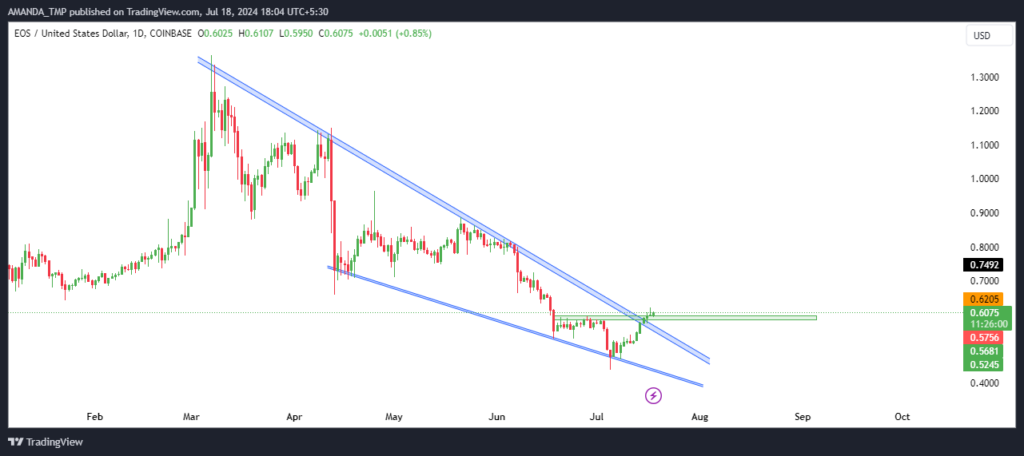
EOS Token Daily Price Chart | Source: TradingView
A swing high of $1.3631 was formed on the 07th of March 2024, and the EOS token’s price since then started to witness profit booking.
The profit booking in the token price led to a strong downtrend, followed by the formation of lower low swing on the charts. Also, the following behavior of the token price led to the formation of a falling wedge pattern, followed by the price for the last six months.
Following the most recent price action, EOS broke out above the pattern but lacked momentum and volume. This shows signs of a fake breakout in the token’s price.
EOS/USD Chart by TradingView
The Supertrend indicator has formed a bullish ATR on the chart, which shows that the token price has taken out a strong resistance. The 50-day and the 200-day EMAs are trading in a death cross, exhibiting a bearish character.
The MACD shows uncertainty as its metrics are trading in a golden cross but still sustain below the zero level. The RSI has advanced above the 14-day SMA and sustained above the 50-level. This shows a surge in the momentum of the token.
EOS witnessed greed among investors, with low supply inflation at 2.81%. The price may face a fakeout despite breaking resistance due to low momentum and volume.
The token’s technical indicators, like the death cross on EMAs and uncertain MACD, suggest bearish tendencies despite some bullish signs. The support levels for the EOS token price are $0.200 and $0.440, followed by the resistance of $0.710 and $0.960.
Disclaimer
This article is for informational purposes only and does not provide any financial, investment, or other advice. The author or any people mentioned in this article are not responsible for any financial loss that may occur from investing in or trading. Please do your research before making any financial decisions.




