
 Altai the Tiger
 IGNITION
 streamoors
 Sword Inu
 NEAR Protocol
 Injective
 Quantus
- OM token has a strong concentration of large holders.
- Mantra’s sentiment was bullish, as per CoinCodex.
A surge in trading activity of the Mantra token was recorded, resulting in an advance of 125% in the token’s traded volume value.
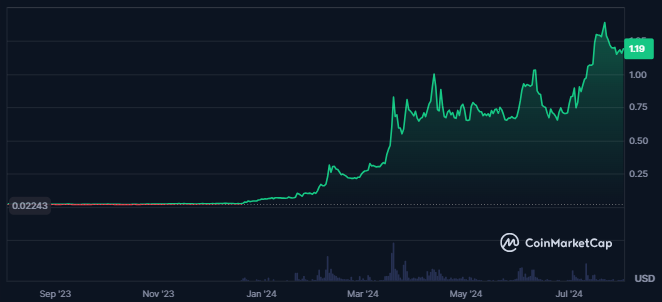
In the last 1 year, the Mantra token price advanced by 5090%, followed by a strong uptrend. When writing, the token’s market cap value was $1.008B, and its market cap ranking was #69.
Additionally, 2.78% of the token’s market cap was being traded in the last 24 hours. This resulted in lower liquidity in the token price while its circulating supply was 836.873M OM.
The fear and greed index for the token indicated greed among the investors at 57. The Mantra token’s market cap dominance was 0.03%, and the price was highly volatile, resulting in 15.49%. This showed a higher possibility of uncertain spikes in the token price.
A surge of 145% in the token’s derivatives traded volume was also recorded, resulting in a traded value of $123.33M. Also, a large amount of shorts were liquidated against the longs of $84.13K in the last 24 hours.
Financial Data Overview Of Mantra Token
Mantra had 12.3K holding addresses, and the top 10 token holders had 46.88% of the total supply. Also, over time, a surge in the number of token holders was recorded.
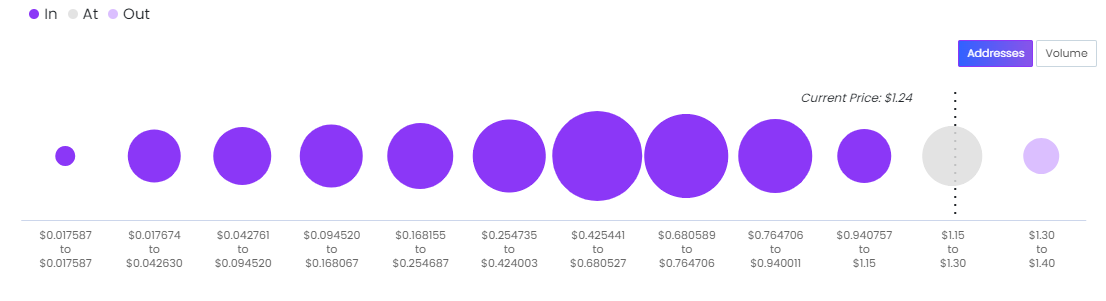
Of the total holders of the Mantra token, 92% were in profit as they bought it at a lower price, resulting in 10.68K addresses. Despite this, 2% of the token holders witnessed loss.
Also, 46% of the token holders have held it for more than 1 year, and 41% have held it for 1-12 months. This showed confidence in the holders of the token for its future performance.
OM Token Technical Analysis
The daily chart of the OM token reveals a series of strong bullish candlesticks, indicating a significant dominance of buyers in the token’s price action. This upward momentum has resulted in a consistent surge, culminating in a strong breakout.
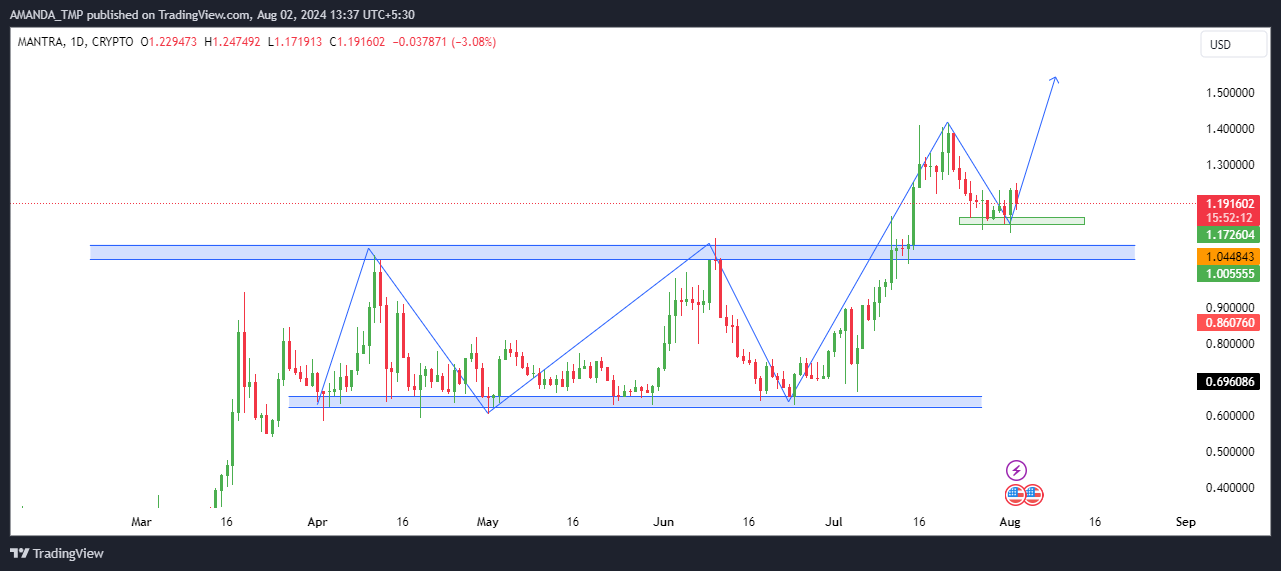
The OM token price was further sustained above the breakout levels and received support. The overall trend of the token price was strongly bullish and showed strong potential for a further surge in the price.
Mantra Token Technical Indicators Overview
The OM token highlights a strong bullish signal from the super trend indicator, further reinforced by a golden cross between the 50-day and 200-day EMAs.
OM/USD Chart by TradingView.com
This convergence has propelled the token’s price to higher levels, trading 70% above the 200-day EMA. The significant divergence between the price and the EMA underscores the strong upward momentum in the OM crypto price.
The MACD metrics have also surged, marked by a bullish crossover between the MACD and the signal line. This crossover is a key indicator of potential continued upward movement.
The Relative Strength Index (RSI) also shows a bullish trend, breaking above the 14-day SMA and surpassing the 50-level. As of the latest data, the RSI stands at 53, indicating strong buying momentum in the crypto price.
OM token price might take support at the levels of $0.660 and $1.110 and could also face resistance at the levels of $1.40 and $2.0.
Disclaimer
This article is for informational purposes only and provides no financial, investment, or other advice. The author or any people mentioned in this article are not responsible for any financial loss that may occur from investing in or trading. Please do your research before making any financial decisions.




