
 Pearl
Pearl Walrus
 Bitway
 Bitcoin
 Quantus
 Quant
Quant Pudgy Penguins
- A surge was recorded in the Celestia token’s traded volume.
- The TIA token sentiment appeared neutral, as per the analysts.
When writing, A surge of 5.7% in the Celestia token market cap was recorded in the last 24 hours. This has resulted in a market cap value of $1.142B, which has led to a market cap dominance of 0.05%.
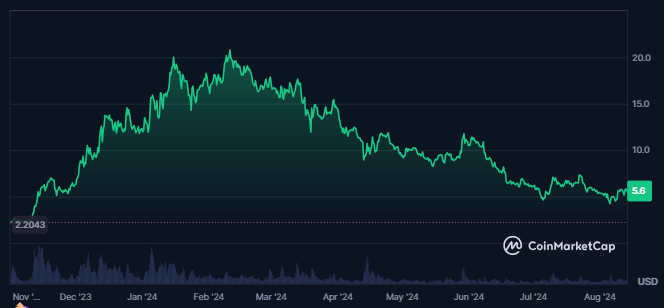
Following the rise in the market cap, the token’s traded volume value also advanced by 53%. Also, the token had good liquidity as the traded volume value in the last 24 hours was $108.543M, which was 7.5% of the market cap.
Celestia had 20% of its total supply circulating in the market, resulting in a circulating supply of 203.728M TIA. Also, the crypto’s total and maximum supply was the same at 1.062B TIA.
Additionally, a surge of 67% in the token’s derivatives volume was recorded, resulting in a traded value of $600.13M. This was followed by a surge of 5.3% in Celestia’s open interest. Also, a higher short liquidation was witnessed in the last 24 hours.
Blockchain Data Overview of Celestia Token
While the total value locked for the Celestia token was nil, its total raised amount was worth $1.5M at press time.
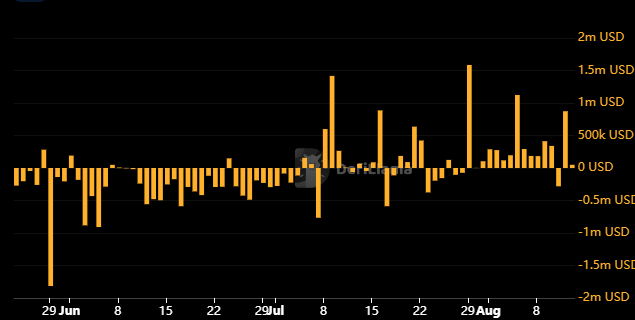
A surge in the inflows of the Celestia token can be seen on the charts. This resulted in an inflow of $3.01M, which belonged to a BBB tier, as per Certik Skynet.
Additionally, the global security ranking of the token was #1241, with a security score of 75.17. Celestia did three fundraising rounds and raised $55.0M in the Series A round. Bain Capital was the largest investor in the token.
TIA Token Technical Analysis
The technical chart of TIA indicated a falling wedge pattern, a structure typically associated with lower low swings followed by lower highs.
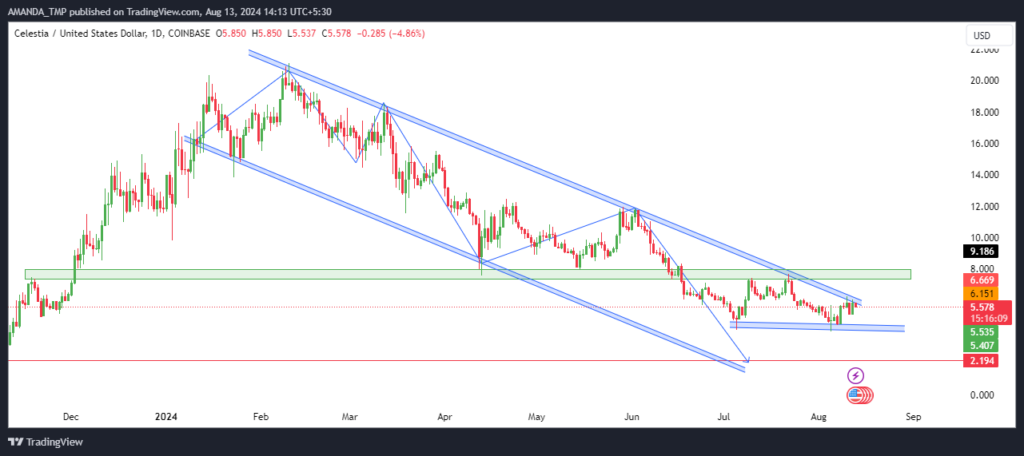
This pattern underscored a steady decline in the token’s price. It reflected a pronounced bearish trend that has developed over time.
Over the past five months, TIA has experienced considerable profit-taking. That led to a succession of bearish candlesticks on the daily chart.
This consistent selling pressure suggested that the downward momentum may continue, further reinforcing the overall bearish sentiment surrounding TIA.
Celestia Token Technical Indicator Overview
The 20-day and 50-day EMAs traded in a death crossover, and the TIA token price also traded below the EMAs. This exhibited a strong downtrend in the token price, followed by the formation of lower lows on the chart.
TIA/USD Chart by TradingView
The MACD and the signal lines formed a golden cross, but both metrics traded in a negative trajectory. This exhibited an uncertain price sentiment for the future.
The RSI seemed volatile as it hovered around the 50 level. It crossed above the 50 level after sustaining at the lower levels for a long time.
The TIA token price might take support at the levels of $2.10 and $4.40. It might face resistance at $11.80 and $18.0 levels.
Disclaimer
This article is for informational purposes only and does not provide any financial, investment, or other advice. The author or any people mentioned in this article are not responsible for any financial loss that may occur from investing in or trading. Please do your research before making any financial decisions.




