
 Pearl
Pearl Walrus
 Bitway
 Bitcoin
 Quantus
 Quant
Quant Pudgy Penguins
- TRX token price had advanced by 80% in the last 1 year.
- The Tron token’s liquidity was certainly low based on its market cap.
The Tron token’s price had a medium volatility, resulting in 3.5%, which showed stability in price. It had a strong market presence followed by a market cap dominance of 0.60%. This showed its strong presence in the crypto market.
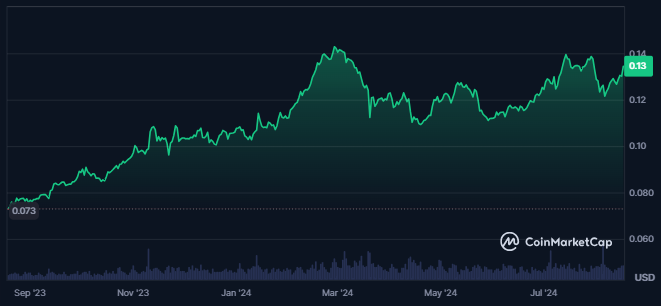
A rise in the Tron token demand was witnessed, which followed a surge of 2.9% in the market cap. Also, the token’s traded volume advanced by 22% in just the last 24 hours, resulting in a traded value of $371.819M.
Also, the Tron was the 11th largest cryptocurrency in the global crypto market, with an infinite maximum supply. Also, the token’s market cap value was $11.694B, followed by a circulating supply of 86.958B TRX.
The token price sentiment was bullish, as per the analysts, while the fear and greed index of the market was at 25. This showed extreme fear among the investors.
A surge in the derivatives activity was also witnessed. This resulted in an advance of 30% in derivatives traded volume in the last 24 hours. The open interest also advanced by 20%, and more shorts were liquidated in the token.
Tron Token’s Financials and Holders Data
Tron token had 251.259M holders at the time of writing, followed by the same number of active addresses.
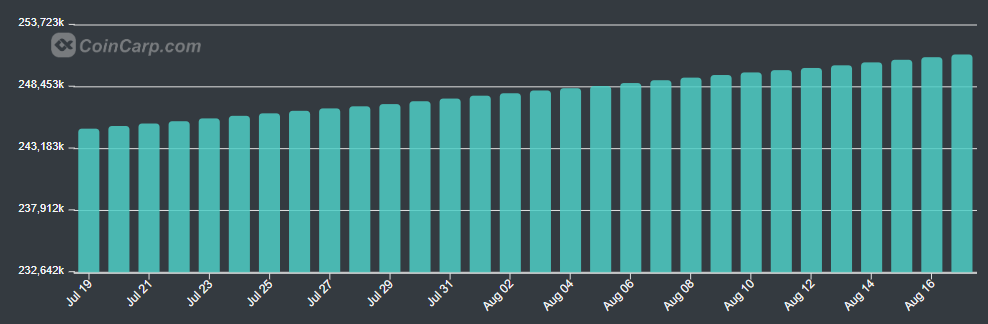
The Holders chart further showed a consistent rise in the number of token holders over the last few months.
Also, 94% of the token holders were in profit, while 6% of the holders were sitting in at the money. The large holders’ concentration in the token was 66%, and the price correlation with the Bitcoin was 0.83.
Additionally, 61% of token holders have held it for over 1 year, and only 6% have held it for less than 1 month.
TRX Token Technical Analysis
The TRX price has shown steady and consistent growth over the past few years, demonstrating resilience and an upward trajectory.
Over the last eight months, TRX has maintained a dynamic trendline, which has supported the cryptocurrency’s sustained advance.
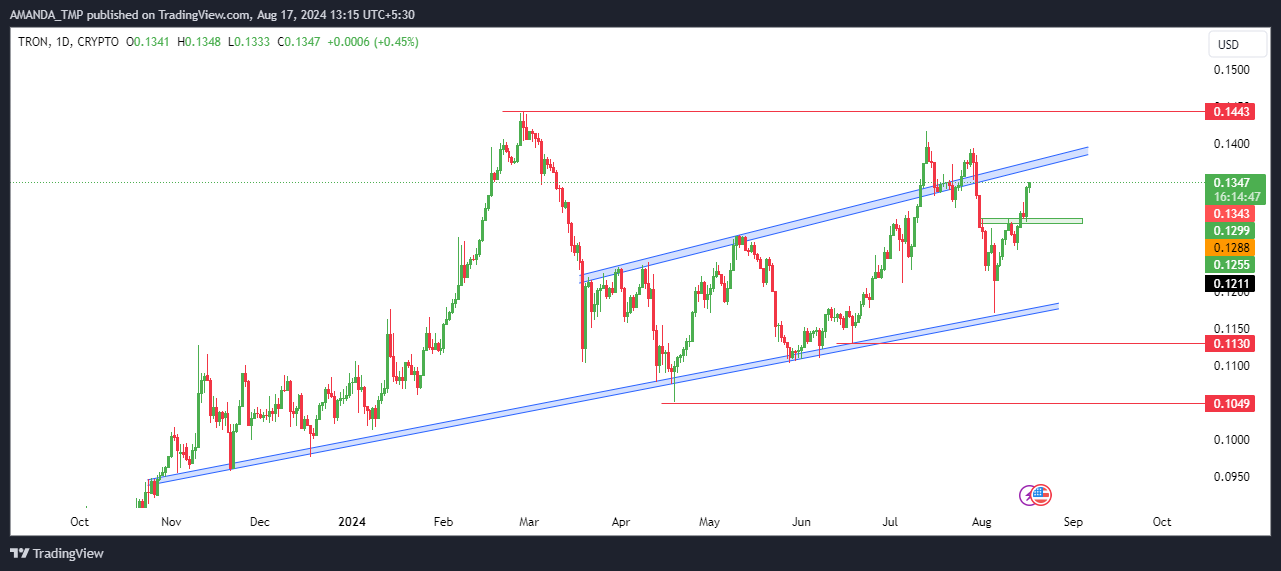
Recently, TRX rebounded from a swing low of $0.00110, which aligned with this trendline. In just the past 15 days, the price has surged by 15%, reinforcing the strength of its ongoing uptrend.
Currently, TRX is trading within a rising wedge pattern, a formation that typically signals an existing uptrend. If TRX can break above this pattern, it could trigger a significant surge in price, further enhancing its bullish momentum.
Tron Token Technical Indicator Analysis
TRX has demonstrated notable strength by trading above both the 50-day and 200-day EMAs, with these moving averages forming a golden cross—a strong bullish signal. The current price is 4% above the 50-day EMA, underscoring the momentum behind the ongoing trend.
TRX/USD Chart by TradingView.com
The MACD and signal line have also shifted into a bullish trajectory, with the chart displaying a series of bullish histograms. These indicators, trading in a golden cross, further reinforce the positive outlook for TRX.
The Relative Strength Index (RSI) has also climbed into the overbought zone, supported by a breakout above the 14-day SMA. This advance highlights the strong dominance of positive momentum in TRX’s price action, signaling continued upward potential.
The TRX token might take support at the level of $0.10 and $0.110, followed by the resistance levels of $0.150 and 0.20.
Disclaimer
This article is for informational purposes only and does not provide any financial, investment, or other advice. The author or any people mentioned in this article are not responsible for any financial loss that may occur from investing in or trading. Please do your research before making any financial decisions.




