
 Zylo Ecosystem
 Pearl
Pearl Walrus
 Derive
 Quantus
 Aerodrome Finance
 Sui
Sui
- Uniswap token witnessed a huge surge in its traded volume in just the last 24 hours.
- UNI token price traded 1500% above its all-time low price at press time.
In the last 1 year, the Uniswap token price witnessed a surge of 45%. The token price was highly volatile, resulting in a volatility of 10.35%.
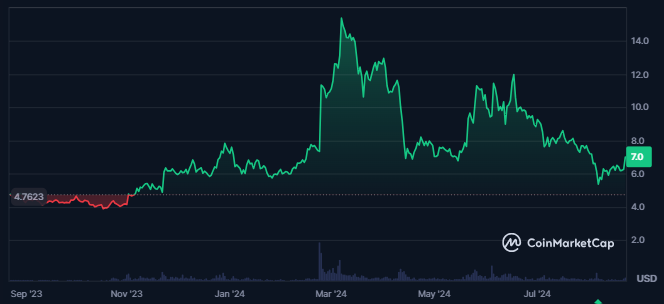
The fear and greed index of the Uniswap token was at 39, which showed fear among the token’s investors. Also, the token sentiment was neutral and had a strong market presence, followed by a market cap dominance of 0.20%.
The Uniswap token’s market cap was worth $4.193B at press time. It advanced by 6.8% in just the last 24 hours from the press time. Also, Uniswap was the 22nd largest cryptocurrency in the global crypto market.
Following the surge in Uniswap token’s market cap, the token’s traded volume value advanced by 103%. It resulted in a traded value of $173.143M. This was followed by medium liquidity and a volume/market cap of 4.26%.
The token’s Total Value Locked was worth $5.201B, resulting in a market cap/ TVL ratio of 0.8061. The token’s circulating supply further was 600.109M UNI, followed by supply inflation of 3.71%.
Financial Onchain Data Overview Of Uniswap Token
Uniswap token’s liquidity was worth $52.41M at press time, followed by an annualized fee of $554.03M. Additionally, the token had 382K holders, and its top 10 holders held 50.81% of the total supply.
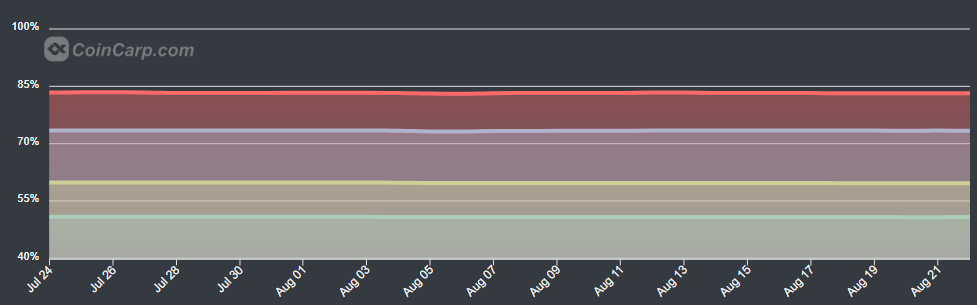
When writing, 40% of the token’s holders were in profit. In contrast, 54% were in loss and bought the token at higher prices. Moreover, the large holders’ concentration in the token was 84%. Also, 82% of the total holders had held the token over 1 year.
UNI Token Technical Analysis
The UNI token price traded in a strong downtrend for a long time. A lower low swing on the technical chart followed this.
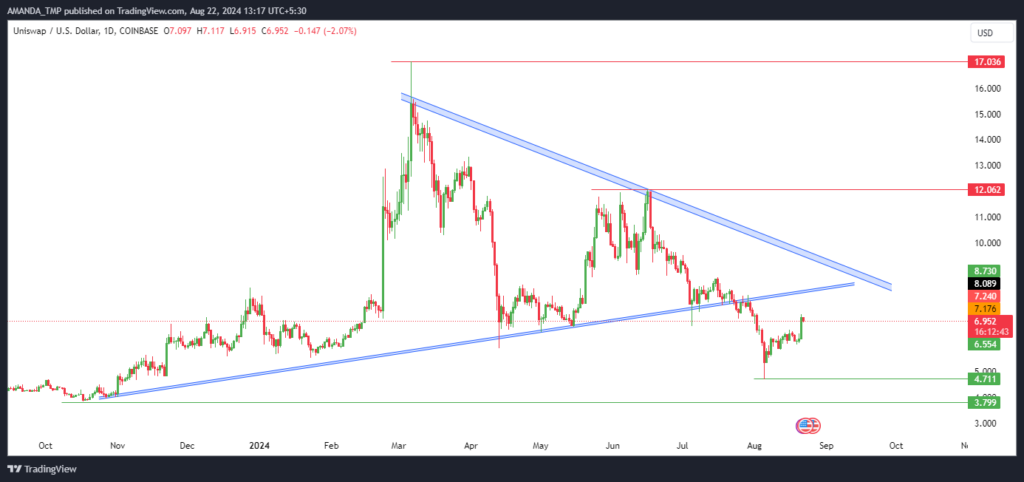
The following declining behavior of the UNI token price led to the formation of a symmetrical triangle pattern. The price formed a swing high of $17.033 on 06th March 2024. Since then, it has started to witness consistent profit booking and has lost 70% of its value.
The UNI token price further broke below the triangle pattern and sustained at the lower levels. This exhibited a strong bearish behavior and dominance of sellers in the price.
Uniswap Token Technical Indicator Analysis
The UNI token price traded below the 50-day and the 200-day EMAs on the daily chart. The EMAs further formed a death cross a few days ago. This exhibited a prior downtrend in the token price.
UNI/USD Chart by TradingView
The MACD signal showed uncertain behavior regarding the UNI token price. This is because the MACD and the signal line traded in a bullish cross. Despite this, the metrics traded negatively, and the histograms were bullish on the chart.
The RSI further broke out above the 50-level and the 14-day SMA. It showed a rise in the bullish momentum in the short term.
The UNI token price might further take support at $3.80 and $4.70, followed by the resistance levels of $12.0 and $17.0.
Disclaimer
This article is for informational purposes only and does not provide any financial, investment, or other advice. The author or any people mentioned in this article are not responsible for any financial loss that may occur from investing in or trading. Please do your research before making any financial decisions.




