
 astronaut
 Pearl
Pearl Zcash
Zcash Walrus
 NEAR Protocol
 Starknet
 Pudgy Penguins
- The 20-day, 50-day, and 200-day EMA bands pose significant resistance.
- On-chain data suggested growing accumulation and a positive outlook for GALA‘s future.
- Derivatives market activity indicates a bullish sentiment for GALA.
After remarkable gains in early 2024, Gala (GALA) saw its price plummet, wiping out most of its gains by Q3. On August 5, 2024, the GALA price chart showed a liquidity grab at a dual support zone. It was aligned with a historical demand zone and the lower border of the wedge.
Despite a breakout attempt, bearish forces kept the price below the 20-day EMA. Over 45 days, the price has only recovered 36% of its previous gains.
The 20-day, 50-day, and 200-day EMA bands present significant resistance that could hinder further gains. However, the outlook could change if GALA managed to break through these levels. Read on to explore whether the GALA crypto can recover or if it will remain bearish.
GALA Price Spot & Derivatives Numbers Showcase Optimism?
The GALA price was trading near $0.01850 at press time, with a 6% intraday increase. Its market capitalization has risen to $642.51 Million. As per CoinMarketCap, it ranked 91st among the top 100 cryptocurrencies by market cap.
In the last 24 hours, the GALA crypto saw a spot trading volume inflow of $63.69 Million. It marked a 46.88% increase from the previous session.
This surge in volume reflected growing liquidity and demand for the asset. The ratio between its market cap and spot volume inflow stood at 9.84%, indicating optimism.
According to Coinglass, GALA’s OI-weighted funding rates have slightly reduced bearish dominance, now at -0.0101%. This signaled a shift toward market optimism. Traders have been increasingly betting on the potential for the GALA price to rise.
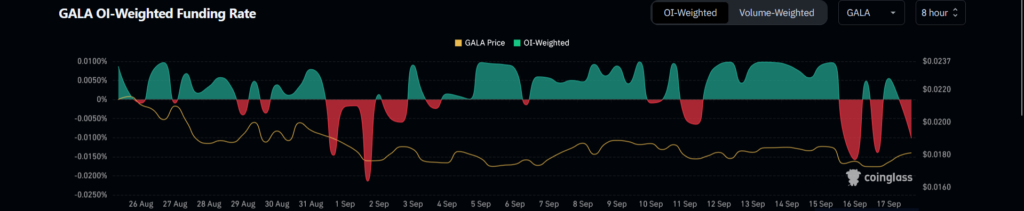
GALA’s open interest has also grown to $53.85 Million, a 3.48% increase from the previous session. The 24-hour long/short ratio is 1.0437, showing more short positions than long ones.
The derivatives volume surged by 41.79% to $150.72 Million. It reflected heightened demand in the derivatives market.
In the past 24 hours, $260.30K worth of short positions were opened. On the other hand, $59.27K in long positions were liquidated. This scenario suggested a positive outlook for GALA crypto.
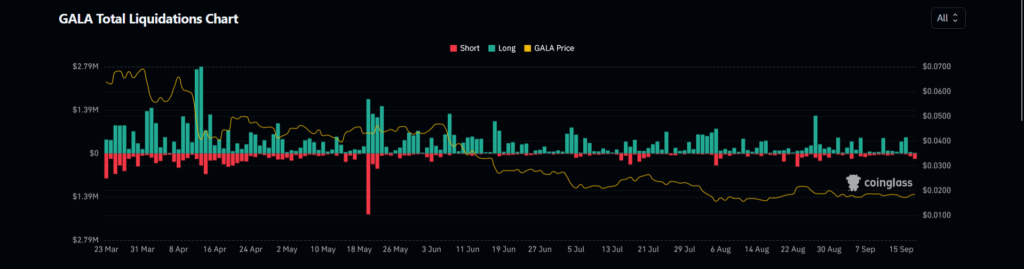
Additionally, the increase in open contracts and higher short-side liquidations indicated a potential rally in the sessions ahead. These metrics highlighted a strong bullish sentiment for GALA, confirming the recent price surge.
Despite the pessimism in the GALA price, Holders’ interest has not waned yet
Over the past six months, the Gala price decline has resulted in significant losses for many investors. According to current financial data, 94.02% of holders experienced losses, and 1.25% broke even. Moreover, only 4.74% of addresses were profitable.
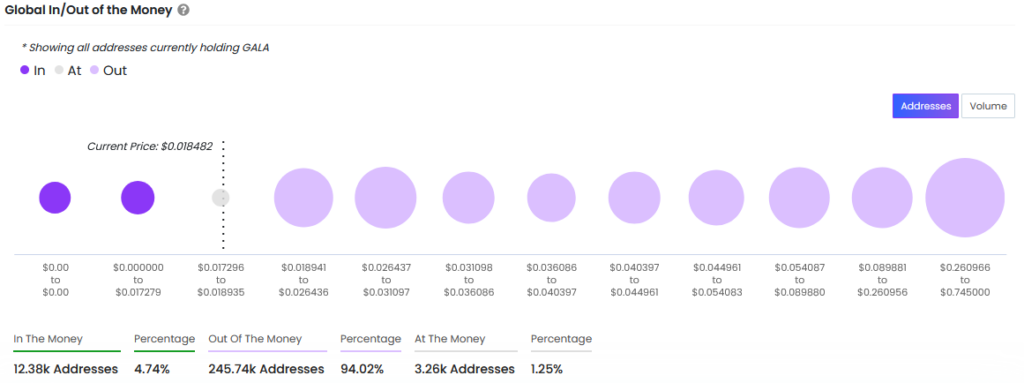
Despite these challenges, there is a strong belief in GALA’s future potential among its holders. On-chain data showed that 258.96K addresses hold GALA, with an upward trend indicating accumulation at lower prices.
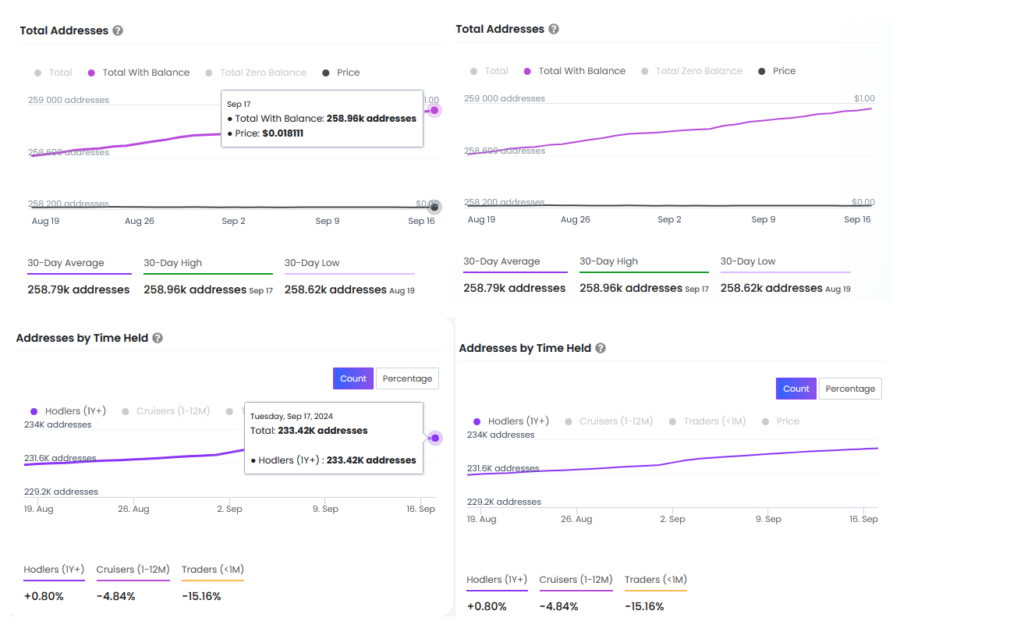
Notably, 233.42K of these addresses have held GALA for over a year, which has increased since last month. The holding pattern revealed a higher concentration of investors and whales, with minimal retail participation.
This data suggested that GALA crypto holders haven’t sold off their positions despite the losses. Their optimism and willingness to hold could attract more buyers, potentially leading to a price surge in future sessions.
Can GALA Turn Bullish Amid Continuous Accumulation by Holders?
The GALA price performance was robust until early March 2024, peaking at $0.086279. However, it struggled to maintain these gains. It was accompanied by the bullish trend failing and the price forming lower lows amid a declining trendline.
Efforts to sustain gains were evident as the Gala price formed a support level at $0.0384. This followed a liquidity grab on April 13, 2024. For nearly two months, the price consolidated within a Darvas box range in an attempt to surge.
On June 7, 2024, the support was lost following a significant sell-off from the upper boundary of a wedge formation. It coincided with the 50-day and 200-day EMA bands.
The breakdown of the Darvas box indicated a loss of critical support for the bulls. This resulted in a sharp decline of over 75% from the ATH of 2024, as the price fell within a narrowing wedge.
Despite these setbacks, the GALA crypto chart showed a liquidity grab on August 5, 2024. Over 45 days, the price has only recovered 36% of its previous gains from the historical demand zone.
The 20-day, 50-day, and 200-day EMA bands present significant resistance that could hinder further gains. However, the possibility of the outlook changing would be if GALA managed to break through these levels.
A critical level to watch in a bullish stance is $0.02686. This could be pivotal for a rebound and Change of Character (CHoCH).
Per the GALA price prediction, support levels were at $0.012533 and $0.016055. On the other hand, resistance levels were at $0.026864 and $0.038141.
Disclaimer
This article is for informational purposes only and does not provide any financial, investment, or other advice. The author or any people mentioned in this article are not responsible for any financial loss that may occur from investing in or trading. Please do your research before making any financial decisions.




