
 streamoors
 Celestia
 IGNITION
 Injective
 Pudgy Penguins
 LayerZero
 Quantus
- Arweave is currently rallying under the bearish clouds
- The token has its current market price at a 24-hour low mark
- Its price suffered from a loss of 9.79% during the intraday session
AR took a fall after the sudden price reduction occurred in the last few hours. It took a toll on its current performance where many thought that its previous stagnant position on the chart would end up slowly in a climb. The disappointing rally of Arweave made it face a reduction in its volumetrics. The market cap of AR suffered from a loss of 11.31% during the intraday session. Its volume saw a sudden surge of 163.35% due to the token’s dip. The volume to market cap ratio stands at 0.07926. The AR/BTC pair faced an intraday loss of 5.52%, followed by the AR/ETH’s decrement of 5.3% during the intraday session.
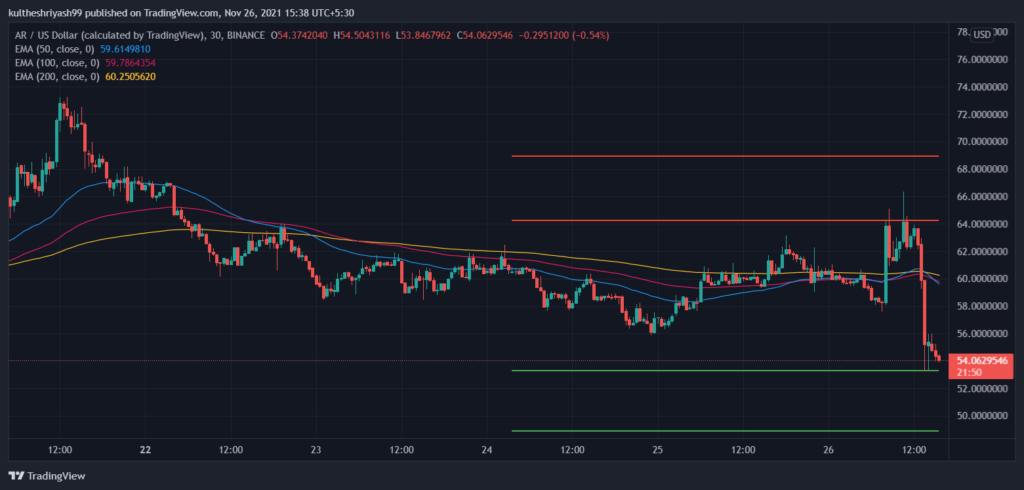
The 30-minute time frame chart shows how much the token is currently suffering. AR’s struggle to maintain stability has been visible enough since the start of the week. The gradual fall in its price and then a failed attempt to climb up the chart makes its position worse in the market. The EMA lines were running with the market price of Arweave before the dip, now they are left stranded above the current market price candle by over 60% before the dip. The EMAs are now proving to be fatal and resisting the climb of AR. The current dip suggests that the token may get even lower than the current position before reaching its demand zone.
Oscillators advise refraining from trading AR for now due to its instability
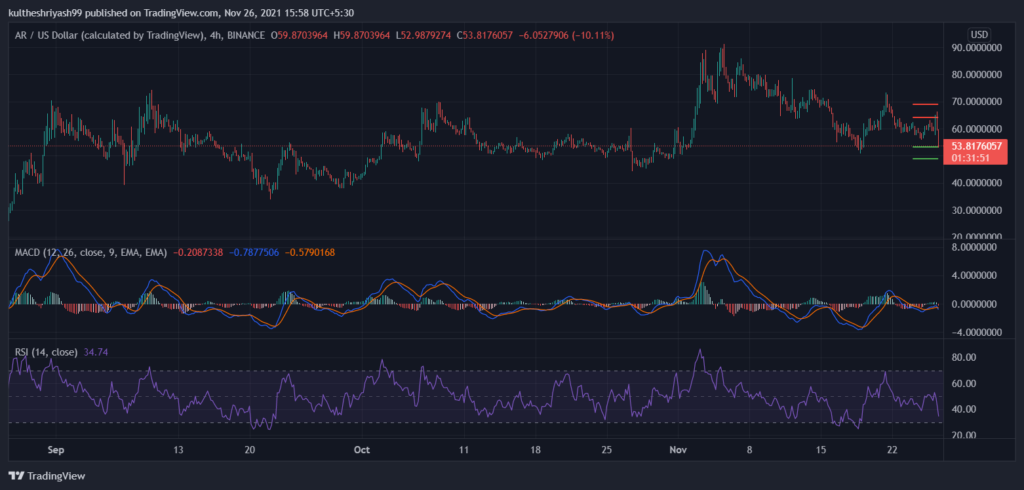
The 4-hour chart shows the number of attempts Arweave has made before to climb and maintain its price. Its tendency to climb and then suffer from a fall has been periodic. For example, consider the start of the month’s climb and then the fall after that. It resembles September’s rise and fall pattern. The MACD line is under the zero level, and dipping below the signal line indicates a bearish trend in continuation. The RSI graph also shows the token is progressing towards getting into the oversold zone as the price descends.
The resistance is at $64.213 and $68.920. The support is at $48.875 and $53.282.
Conclusion- Arweave’s current rally is uncertain and strongly bearish. Its immediate position where the token may create a demand zone is inconclusive at the moment but if the investors are willing to enter the market, the current position may serve as an entry point. Nonetheless, one should invest only after conducting research and considering all the market risks.
Resistance- $64.213 and $68.920
Support- $48.875 and $53.282




