
 Dacity Coin
 NEAR Protocol
 Pearl
Pearl Pudgy Penguins
 Injective
 Aerodrome Finance
 Pump.fun
- Theta Network coin is moving higher after interrupting the descending trendline and about to close a bullish weekly candle.
- Theta coin is trading above the significant moving averages and moving towards the 100-EMA line.
- Theta/BTC pair is trading at 0.00007619 satoshis, which is up by 4.91%.
Following a period of consolidation in a small trading range, Theta Network Coin looks to be in a rebound phase. The price of Theta Network, on the other side, soared by 90% in less than three weeks, hitting $4.3 from its 52-week low on February 11. Furthermore, on February 10, buyers broke through the especially strong resistance trendline, signaling the bulls’ plan to initiate a rebound, but sellers reacted and the coin’s price plummeted.
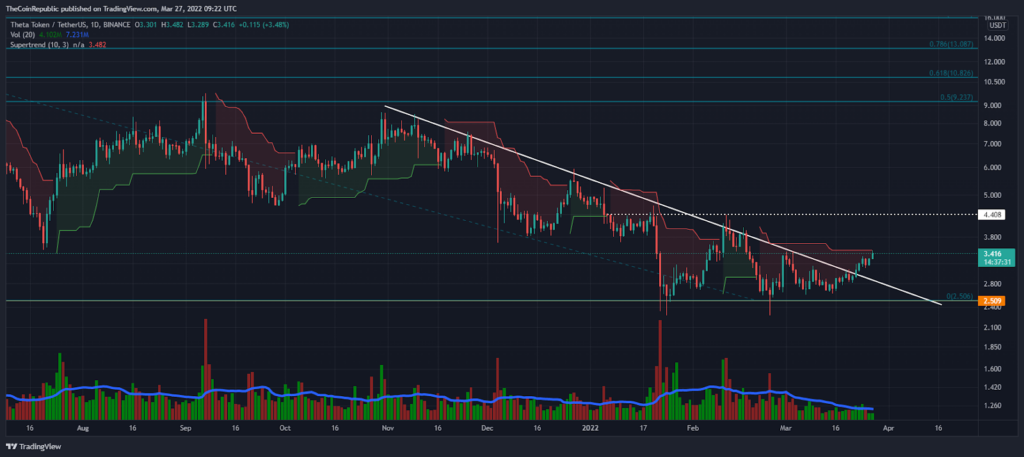
At the time of this writing, Theta coin is trading at $3.41, which is up 5.5% (as per CMC data). Volatility is gradually increasing during the bullish momentum which generated buyer interest, resulting in the coin gaining around 7.7% of trading volume in the previous night. Meanwhile, the volume to market capitalization ratio is 0.06866.
The 2022 year’s lowest level acts as a vital support level for the buyers because bear attempted to dump the price below it multiple times and the $4.4-level could be the upcoming resistance zone. Beside, the Theta network price concerning the Bitcoin pair is trading at 0.00007619 satoshis, which is up by 4.91%.
Theta coin price is moving towards the red indication line of the Super Trend indicator with reference to the daily price chart. It remains to be seen whether the bears will agree to push the asset cost above the signal line.
What do technical indicators say about theta coin?
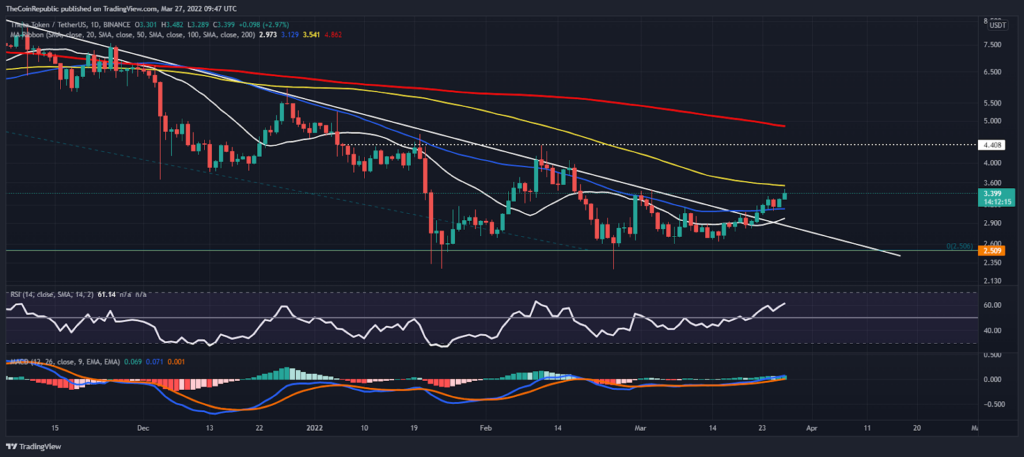
In the context of the daily price chart, theta coin price is going towards the 100-day EMA after remaining above the 20- and 50-day EMAs. Buyers who break above the 100-EMA might aim for the 200-EMA.
The daily RSI is showing above the halfway mark (50 points) after a long time consolidation. At the time of writing, the RSI is at the 60 level, which indicates a bullish move.
After a bullish breakthrough on the daily chart, the MACD indicator looks to be in a positive condition. The MACD line has broken through the neutral zone, but the signal remains in the range of zero.
Conclusion
Theta token price has interrupted the bearish trend after a long time, now buyers have a good shot to push the coin price higher to the next resistance level.
Resistance level- $4.5 and $6.0
Support level- $2.5 and $2.0
Disclaimer
The views and opinions stated by the author, or any people named in this article, are for informational ideas only, and they do not establish the financial, investment, or other advice. Investing in or trading crypto assets comes with a risk of financial loss.




