
 Sword Inu
 streamoors
 Altai the Tiger
 no crying in the casino
 IGNITION
 Pudgy Penguins
 Quantus
- AAVE token is stayed near the support range of $50.
- Bulls are feeding momentum to enrich the gains soon.
AAVE price is taking a pause near the support and round level of $50 and waiting for a bounce above the 20 day EMA. Moreover, the token is already spent much time and ready to escape the range soon.
The ongoing price action shows that bulls were engulfing the selling pressure in the last trading sessions and ready to take a reversal play in the next sessions.
AAVE price stayed below the key moving averages and showed lack of strength and the small size of candles formed in the last three trading sessions showed low interest of investors and with lower volumes.
When writing, AAVE is trading at $51.27 with an intraday drop of 0.98% showing neutral signs. Moreover, the trading volume was seen with an increase of 3.80%, indicating the nominal interest of investors. The pair of AAVE/BTC is at 0.00194 BTC and the market cap of AAVE is $744.33 Million.
In the last months, AAVE was faced with a correction over the top of $90 and showing continuous decline from there resulting in the drop of more than 30% in the last months. The token has shown downtrend and continued to form lower lows sequences since the start of 2023.
Daily Chart Structure of AAVE shows weakness
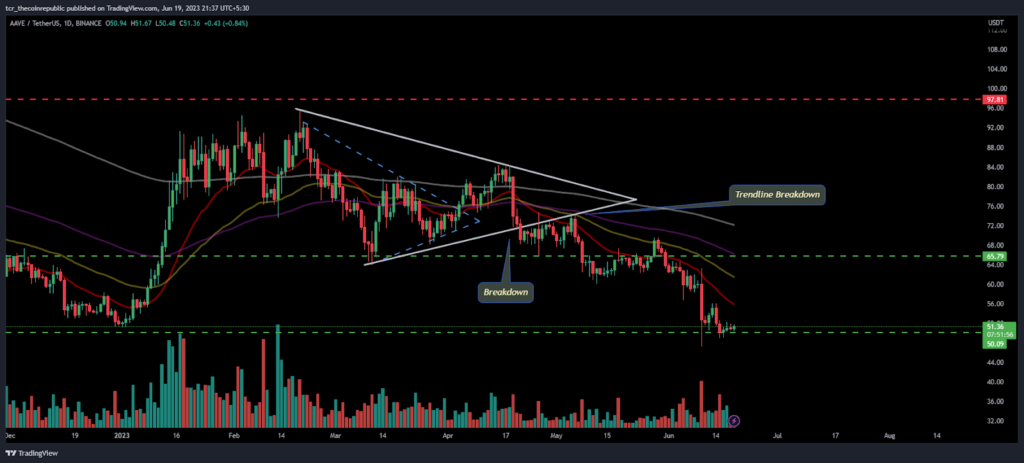
On the daily charts, AAVE token is forming a doji candle from the past three trading sessions and looking to escape the range to attain the 20 day EMA mark in the next sessions. However, due to the lower trading volumes, buyers unable to lead the rebound and hovering near the round level mark of $50 facing lack of momentum.
As per the Fib levels, AAVE is below the 23.6% level and showed negative outflow of the token due to the sellers dominance on the charts. Perhaps the price is near to the strong demand zone, but a bounce should be anticipated.
AAVE on short term charts shows consolidating moves
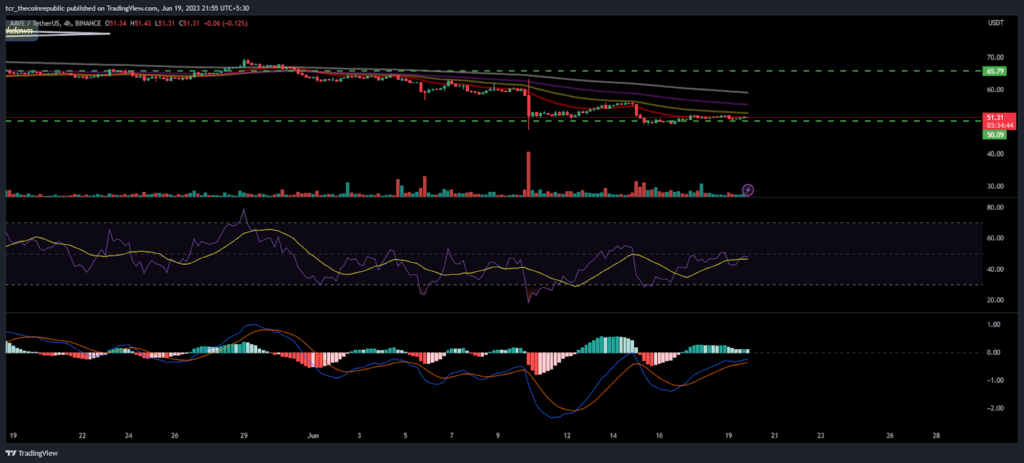
On the 4 hour charts, AAVE token is showing consolidation and is not able to leave the sellers region. Moreover, the pressure on the bulls was noted in the last session which made the candle close below the previous one and indicated sellers attachment in the token.
The RSI curve stayed near the neutrality and hovering near 50 showing a nominal move of the token.
The MACD indicator shows green bars and forms a bullish crossover in the last trading sessions showing positive outlook of the token.
Conclusion:
AAVE token is hovering near the base of $50 and willing to bounce in the next sessions.
Technical Levels:
Support Levels: $45
Resistance Levels: $60 and $70
Disclaimer
The views and opinions stated by the author, or any people named in this article, are for informational purposes only and do not establish financial, investment, or other advice. Investing in or trading crypto assets comes with a risk of financial loss.




