
 streamoors
 IGNITION
 Injective
 NEAR Protocol
 Pearl
Pearl LayerZero
 Hyperliquid
- The Sandbox price slid 1.19% in the past 24 hours and it is currently trading at $0.407.
- SAND whale-holding data states that the whales hold a total of 76.7% of the supply with a decrement of 5.3% over the past 1 year.
The SAND is a blockchain game world that was started in 2011 by Pixowl. Users can create, build, trade, and own digital assets as NFTs. The Sandbox uses DAOs and NFTs to make a platform for gamers that is decentralized.
SAND price is currently trading at $0.407 with a decrement of 1.19% in the past 24 hours. According to CoinMarketCap data, SAND cryptocurrency holds a total market cap of $788.36 Million and ranks 52nd in the crypto market.
It received $50.639 Million in volume in the past 24 hours which is 7.67% more than the last day. It has over 1.93 Billion in circulating supply. The volume-to-market cap ratio of the SAND token is 6.43% which indicates low volatility in the market.
The Sandbox Price Prediction Using Price Action Strategy
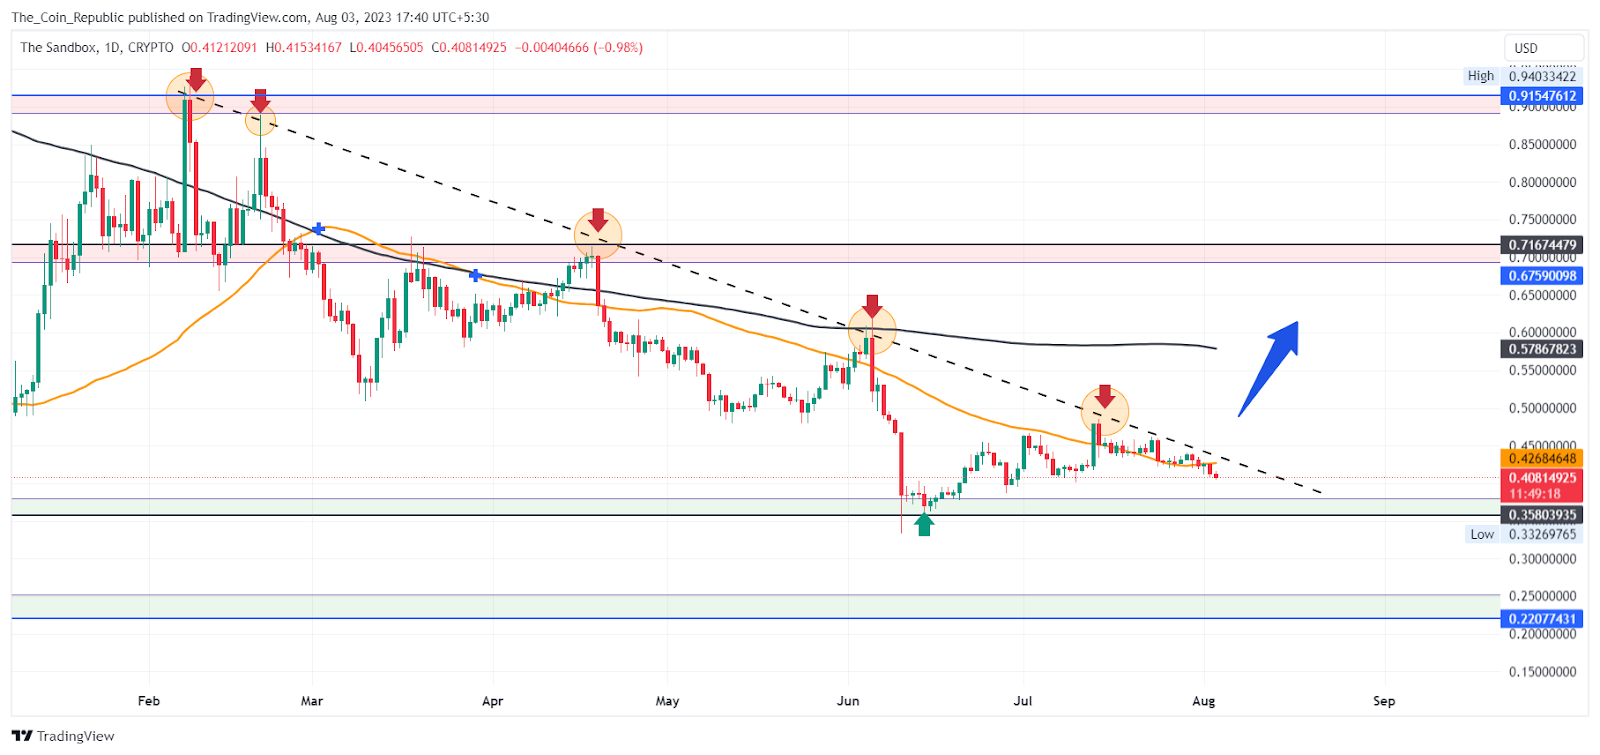
The Sandbox price prediction reveals that the token seemed to be in a long-term declination phase and made a significant decline of nearly 58% in December 2022. Thereafter, the price tried to recover the decline in January 2023 but was not able to change the ongoing trend and suffered rejection after topping out.
Since then, the price has been in a correction phase and declining forming lower highs and lower lows and suffering rejection from an upper trendline resistance.
Recently, the price took a rebound from the demand zone showing the buyers’ presence near the demand zone. The price could not break above the trendline resistance and consolidated.
Now, if the price breaks above the trendline then it may surge higher showing a hike of 50 to 70% in the very short term.
SAND Price Forecast from Indicators’ point of view
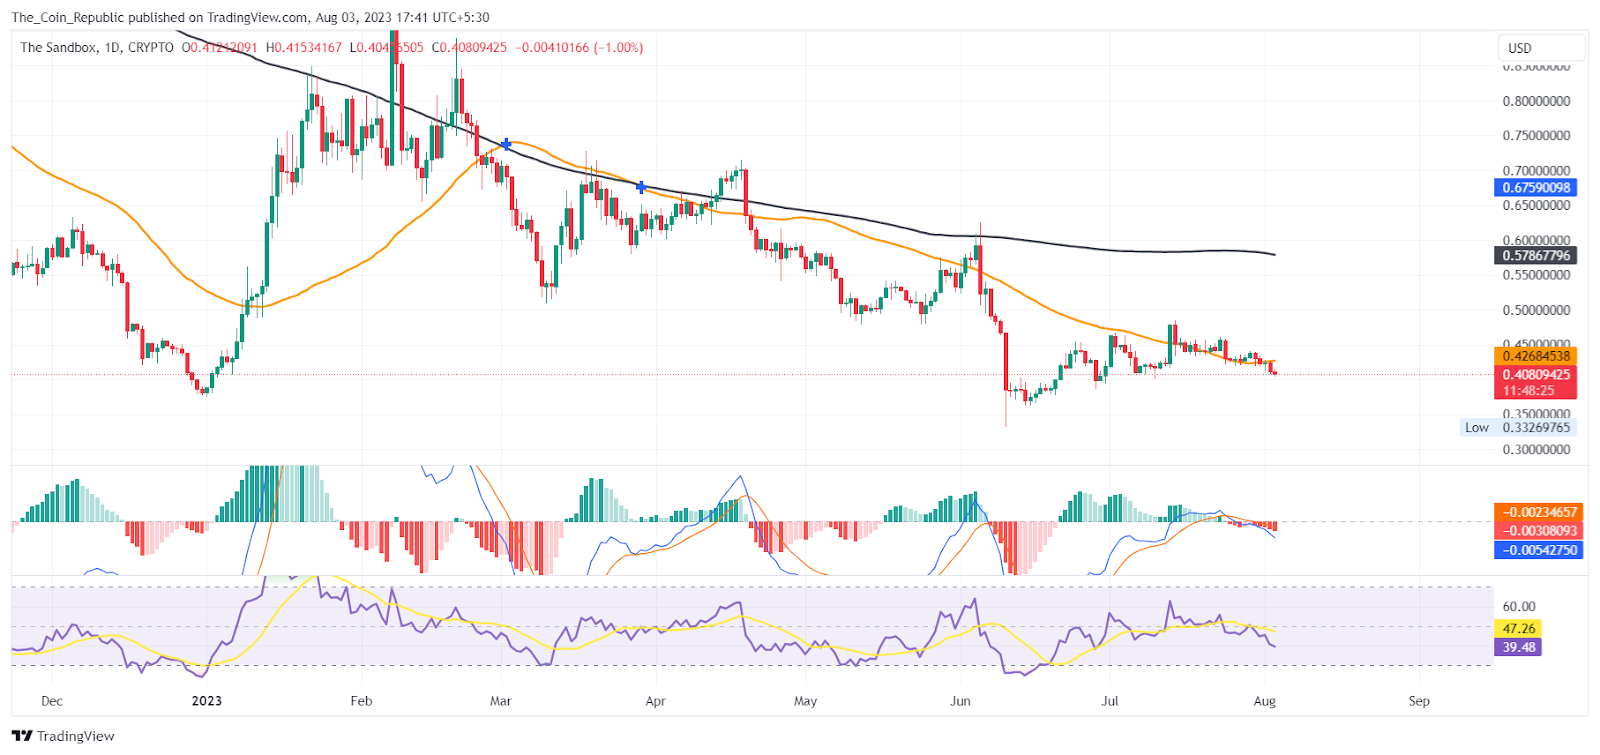
As per the EMA analysis, the Sandbox price currently trying to sustain above 50 EMA. However, the price is below 200 EMA which may act as a resistance as the price approaches it.
At the time of publishing, the RSI value of the SAND token is 38.91 and that of the SMA line is 47.22. RSI is declining suffering resistance from the SMA line indicating neutral to bearish sentiment in the market.
MACD lines are showing a bearish crossover. The histogram bars are being formed below the mean line and the height is increasing which indicates bearishness in the market.
Conclusion
The Sand price prediction concludes that the price has been in a correction phase since February 2023. The price is forming lower highs and lower lows. Currently, the price took a rebound from the demand zone but failed to break above the resistance and consolidated. Now, if the price breaks above the trendline, then surge higher showing a hike to 50-80% in very short term.
Technical Levels
- Support levels: $0.35 and $0.22.
- Resistance levels: $0.71 and $0.91.
Disclaimer
The views and opinions stated by the author, or any people named in this article, are for informational purposes only and do not establish financial, investment, or other advice. Investing in or trading crypto or stock comes with a risk of financial loss.




