
 Dacity Coin
 Quantus
 Pudgy Penguins
 Pearl
Pearl Injective
 Starknet
 NEAR Protocol
- Tilray Brands, Inc. stock price is now trading above the 50, and 100-day EMA levels.
- TLRY’s stock price is currently trading at $2.3.
- Tilray Brands, Inc. (NASDAQ: TLRY )’s live market cap is $1.62 Billion.
Tilray Brands, Inc. (NASDAQ: TLRY ) stock price is currently moving in an uptrend direction. The stock price has given a breakout after hitting an all-time low of $1.53.
Tilray Brands, Inc. (TLRY) stock has a market cap of $2.62 Billion with a revenue of $627.12 Million. The stock has a 52-week high of $5.12 and a 52-week low of $1.5. The TLRY stock has a beta of $2.52.
The Tilray Brands stock has shown a 36.5% growth in the last month. The revenue of the TLRY stock in the last three quarters has increased from $144 million to $184 billion, with an average increase of 11% per quarter.
Tilray Brands (TLRY) stock made a high of $300 in September 2018 and the stock price started declining after this. The stock fell by almost 99% by the end of March 2020. However, the stock found support at $1.53.
The price of TLRY has increased up to 65% after taking the support. In the past week, the stock price has increased by 6% (approx.). TLRY’s price is currently edging toward the point of resistance, and it is quite likely that it will rise during the coming days.
The price of Tilray Brands, Inc.’s stock indicates that new highs will be attained soon, and the weekly timeframe structure of the stock is strong.
Tilray Brands, Inc. (TLRY) Stock Price Analysis
EMA
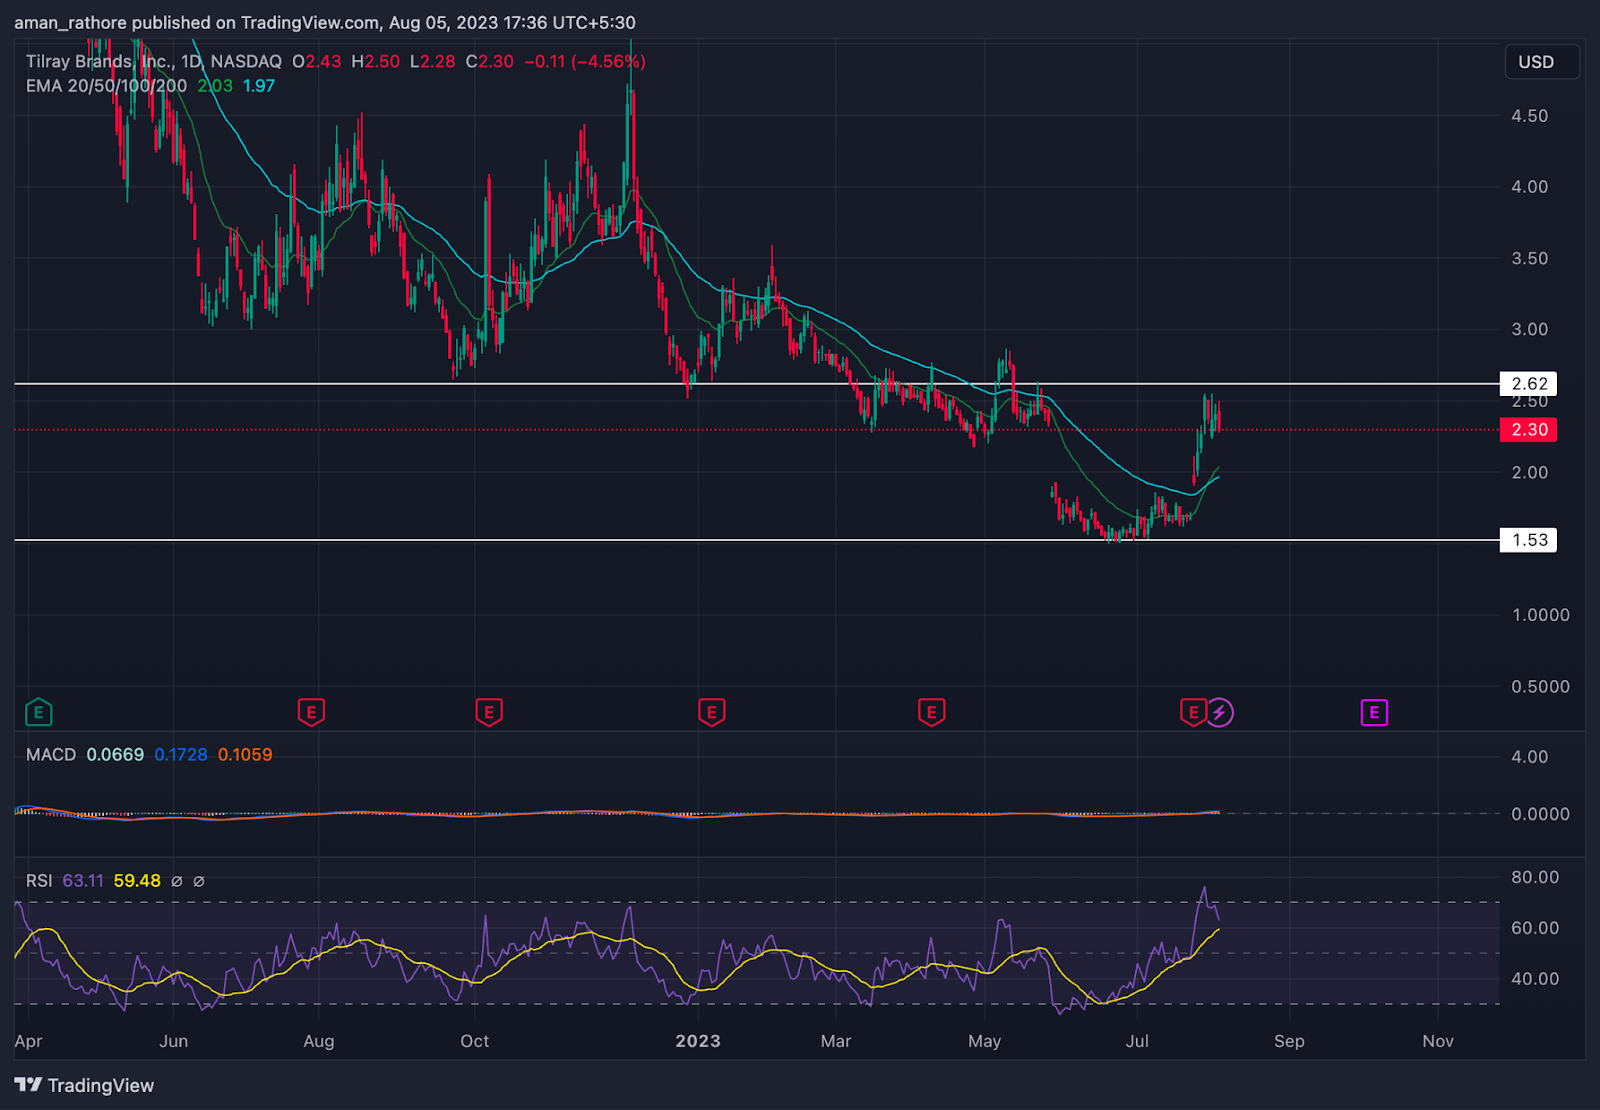
The prices of Tilray Brands, Inc. are currently trading above the 50-day and 100-day EMA levels. This shows that the stock is now in an uptrend and that further price gains might be expected.
MACD
The MACD line for the TLRY stock price is above the signal line and both lines are also above the zero line. Additionally, the creation of a green histogram is visible which signals continued growth of upward pressure in the stock.
RSI
The 14-day SMA line and the RSI line for the price of Tilray Brands, Inc. (TLRY) shares are both close to 70. This indicates that both lines are in the positive area suggesting that the price may rise in the future.
Conclusion
In conclusion, the research shows that Tilray Brands, Inc. (TLRY) stock price is currently in an uptrend momentum and may continue to climb in the future. Price has reached new highs, and indicators are also giving off positive signals. This suggests that the stock price will rise much more in the days to come.
Technical Levels
- Support Level– $1.53.
- Resistance Level– $2.62.
Disclaimer
The views and opinions of the author, or anyone named in this article, are for informational purposes only. They do not offer financial, investment, or other advice. Investing or trading crypto assets involves the risk of financial loss.




