
 streamoors
 IGNITION
 Quantus
 Sui
Sui Zcash
Zcash Ethereum
 Pearl
Pearl
- DYDX price is currently at $2.10.
- The DYDX coin has a market cap of $314.2 Million.
- The 24-hour volume of DYDX crypto is $38.18 Million as on 9th August 2023.
dYdX (DYDX) tokens can be traded on centralized cryptos exchanges. dYdX (DYDX) cryptocurrency is now moving in a downward direction. The coin has a low volume and lower lows are being formed as the DYDX price.
dYdX (DYDX) coin’s market capitalization has decreased by 3.4% during the past 24 hours to $314.2 million. This implies that sellers are taking positions and the coin is experiencing downtrend momentum.
The 52-week high of the DYDX coin is $2.12 and its 52-week low is $2.06. As of August 9th, 2023, the coin’s average volume was $38.18 million, a fall of 1.9%. The fully diluted valuation of the DYDX is $2,117,931,659
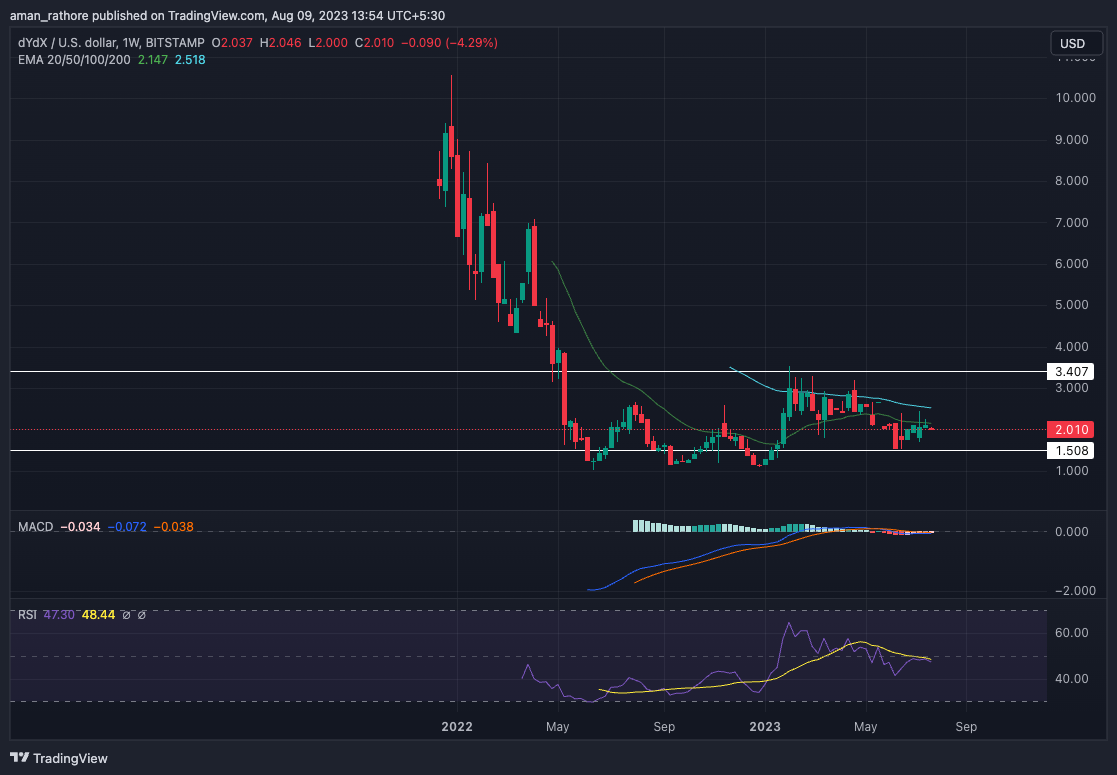
On December 2021, dYdX (DYDX) reached a peak of $10.55; since then, the price of DYDX has been falling. The coin price has fallen by around 90% in just a month.
dYdX coin is currently trading between the range of $3.4 and $1.5 based on the market’s state. In a month, the price of DYDX dropped by about 6.47%.
The general structure of the coin is building a bearish structure, and the coin is now developing a weak pattern. This suggests that the price will probably decrease during the upcoming days.
dYdX (DYDX) Price Analysis
EMA
The price of dYdX is currently trading below the 50-day and 100-day EMA levels. This indicates that the price is developing a weak pattern and might fall in the upcoming days.
RSI
The RSI line for the price of the dYdX currency is currently trading below the line for the simple moving average. The RSI is also very close to the 30 level. This implies that the price might drop in the future.
MACD
Currently, the signal line is below the MACD line for the dYdX currency. The coin has lost all of its strength, and the fact that both lines are currently trading below the zero line suggests that the price may drop soon, further supporting this view.
Conclusion
The analysis shows that the price of dYdX (DYDX) is exhibiting signs of negative momentum, which may favor a price fall in the future. Near-term negative momentum is also predicted by indicators like the MACD and RSI. The coin’s volume is likewise shown to be decreasing. This demonstrates that buyers lack the desire to make open positions.
Technical Levels
- Support Level – $.1.5
- Resistance Level – $3.4.
Disclaimer
The views and opinions of the author, or anyone named in this article, are for informational purposes only. They do not offer financial, investment, or other advice. Investing or trading crypto assets involves the risk of financial loss.




