
 streamoors
 Altai the Tiger
 Sword Inu
 IGNITION
 no crying in the casino
 Quantus
 NEAR Protocol
- The Beta of RKT share is 1.59 resulting in an average volume of 2.03M.
- The ROE for the company stands at -0.58% which is a neutral signal for the stock.
- The PE ratio for Rocket Companies, Inc. is 5.72. It represents that the investors are willing to pay more than the per-share earning of the stock.
Price Data of Rocket Companies, Inc. Share
The EPS for the RKT stock is -$0.21 which indicates that the company is losing for each share of its common stock. The dividend yield by the company is 11.41% with a negative payout ratio of -637.98% as per investing.com.
The 52-week range for the stock is $5.97-$11.94. The market cap of the company is $1.14B resulting in an advance of +30.4% year on year. There is an advance of +33.6% in the EBITDA of the company year-on-year resulting in $246.13M. It indicates increased profitability in the company.
The net cash at the company has declined by -6.7% year on year. There is an advance in long-term debt of the company resulting in a $9.71 Billion in Q2 2023 decline by -26.9%.
Rocket Companies, Inc. Performance Analysis
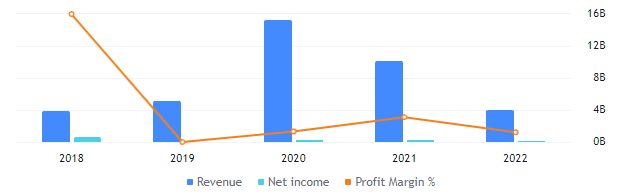
The company’s revenue has decreased from $10.00B to $3.58B in the span of a year. There has been a huge decline in Net Income resulting in $46.44M in the year 2022. The company made a gross profit of 98% out of the revenue resulting in an EBIT of 28%.
RKT Technical Analysis
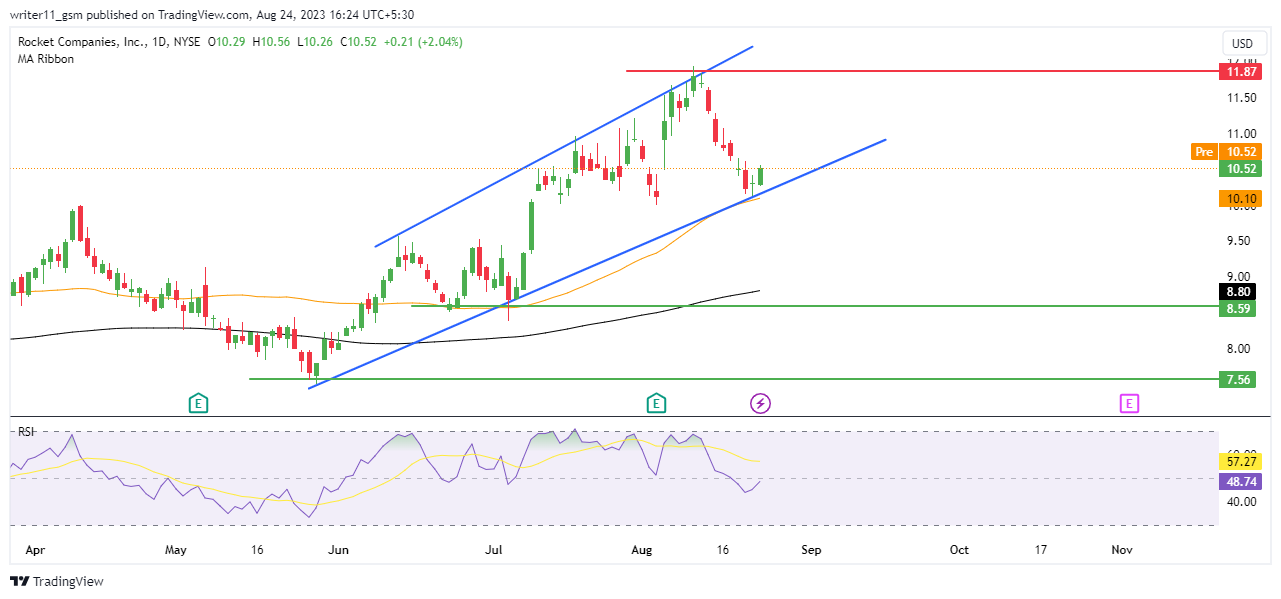
RKT share has consistently advanced from lower levels. it led to a higher high swing and a consistent advance in price which surged the RKT share to the price of $11.95. It made the swing high at the same level and the price has declined from that level. It broke below the previous swing low on charts, which represents a change in the trend of the stock.
The 50-day and the 200-day Exponential Moving Averages are trading in a golden crossover on the daily charts. The price is also trading above the EMA’s which represents a preceding uptrend in the market.
RSI for the stock is trading below the level of 50 and has also declined below the 14-day SMA line. It indicates weakness in the market and also declines in the existing trend. If the RSI sustains below the 50 level, we might get to see further lower levels in the market.
Technical Overview of RKT Stock
As per the indicator summary analysis, 10 indicators are giving a buy signal, 8 are acting neutral, and the rest 8 are giving a sell signal. This indicates the uncertainty in the market which concludes with a neutral signal on the chart.
Conclusion
The share price of RKT Inc. share has recently changed its character and is trading on the verge of a rising wedge pattern. If the price declines below the level, it can lead to a huge decline in price because the RSI is also showing weakness on the charts. The EMA is uncertain on the chart as it is trading in a golden cross. However, the market is in a negative change of character region.
The RKT share price can decline further to lower levels if the sellers continue to drag the market down. It will result in the breakdown of the rising wedge pattern. The EMA’s may also lead to a death cross due to a consistent decline in price.
Technical Levels
- The support levels for RKT Stock are – $7.5 and $8.7
- The resistance levels for RKT stock are – $11.9 and $13.2
Disclaimer
The information provided in this article, including the views and opinions expressed by the author or any individuals mentioned, is intended for informational purposes only. It is important to note that the article does not provide financial or investment advice. Investing or trading in cryptocurrency assets carries inherent risks and can result in financial loss.



