
 IGNITION
 streamoors
 Injective
 NEAR Protocol
 Pearl
Pearl LayerZero
 Quantus
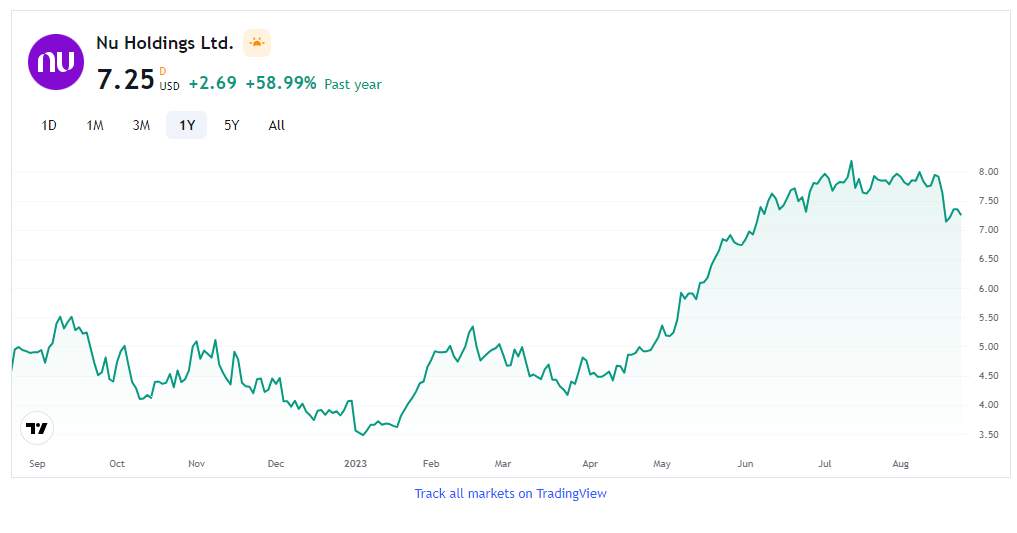
- The NU closed at $7.25 in the last trading session with a decline of -1.36%.
- The company Nu Holdings Ltd. earns $0.02 for each share of its common stock. It has 4.743 billion shares that are available for trading in the market.
Nu Holdings Ltd. was founded in 2016. It does not pay any dividends and its share price has advanced by +61.11% in a year. The market cap of the company has advanced by +113.3% year-on-year and the gross profit has also advanced by +149.50%.
The price-to-earnings (PE) ratio for Nu Holdings Ltd.’s stock is 521.28 following a beta of 0.89. Those figures indicate that the share price moves lesser than the whole market.
The revenue of the stock has suddenly advanced by $2.34 Billion from the year 2021 to 2022. This advance in revenue could not match up in net income. The revenue heavily dropped from -$164.99 Million to -$364.58 Million. The EBIT for the company is -8% and the net income is left at -10%.
Nu Holdings Ltd. Debt Analysis
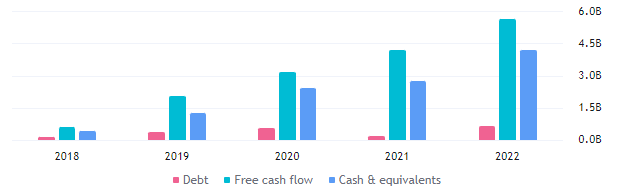
Company has shown a descent growth in its cash flow, advancing from $4.18 Billion in the year 2021 to $5.61 Billion in the year 2022. However, the company’s debt has also increased from $164.88 Million to 605.92 Million for the year 2022.
NU Technical Analysis
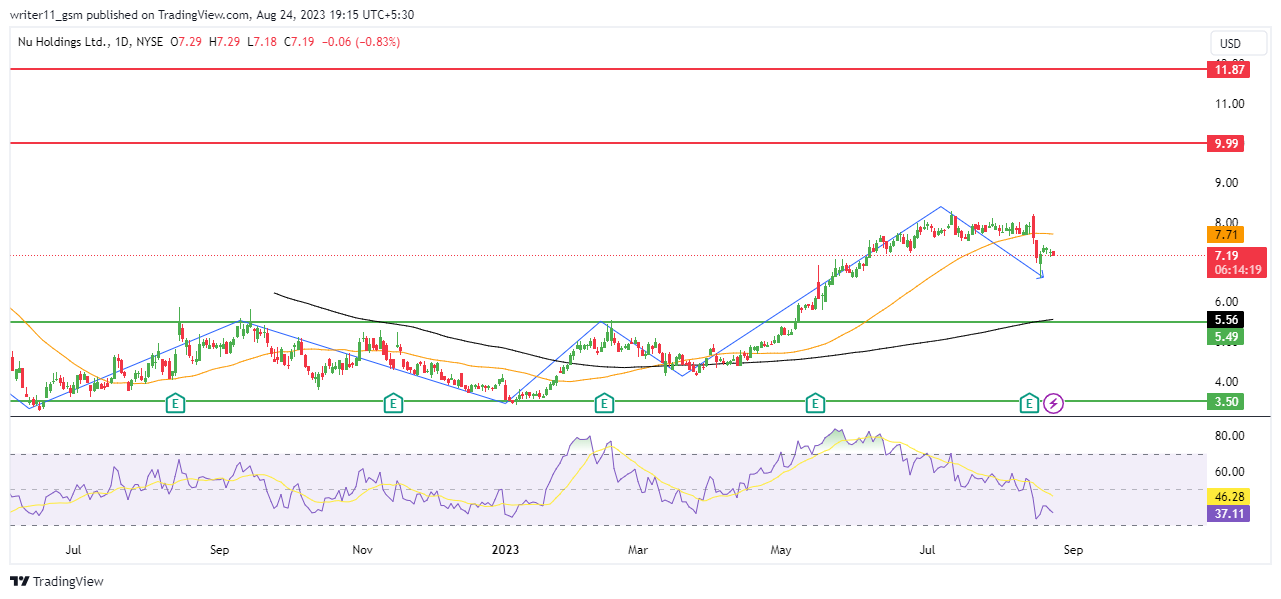
The price of the NU share has been consistently advancing from the lower levels and has broken out of a consolidation zone leading to the formation of higher highs on the charts.
The 50-day and the 200-day Exponential Moving Averages(EMA) are trading in a golden crossover on the daily charts as the price is trading above the both the EMA’s and the price is moving in an upward direction.
The RSI of NU stock is indicating weakness on the chart as it is trading below the 50-level and has also declined below the 14-day SMA line. The current value of RSI is 36.88. This represents the presence of sellers in the market in short term.
Technical Overview of NU Stock
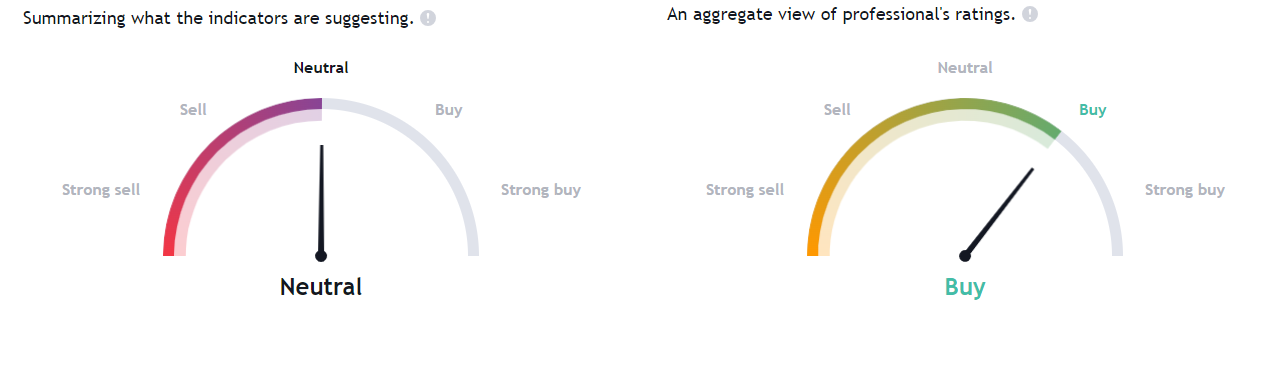
Based upon the data provided on tradingview the technical indicators are acting neutral when summarized and based upon the experts, the analysts are recommending for a buy and are bullish on the stock.
Conclusion
Nu Holdings Ltd. stock price has been consistently advancing from a consolidation zone and is making higher high structure on charts. The EMA is also acting bullish and the price data is descent for the performance of the company but the RSI is acting weak.
Therefore, NU stock may can advance more if the RSI crosses above 50 level as it is a fast moving indicator and the rest of the data is also supporting for bullishness which can lead the stock to the higher prices in the future.
Technical Levels
- The support levels for NU Stock are – $3.50 and $5.50
- The resistance levels for NU stock are – $7.70 and $10.00
Disclaimer
The information provided in this article, including the views and opinions expressed by the author or any individuals mentioned, is intended for informational purposes only. It is important to note that the article does not provide financial or investment advice. Investing or trading in cryptocurrency assets carries inherent risks and can result in financial loss.



