
 Dacity Coin
 Injective
 Pump.fun
 Pearl
Pearl Starknet
 Quantus
 NEAR Protocol
- ZIL coin price has increased by 4.30% since the last trading session.
- The coin price was given at the breakout of 34 days of the consolidation period.
Zilliqa is a public permissionless blockchain designed to provide high throughput with the capability to complete thousands of transactions per second. The coin was launched in June 2017 but its test was in the same month of the next year. As of 2020, it has become a platform where many decentralized applications work.
Zilliqa (ZIL) Coin: Technical Analysis
The Zilliqa coin price has been surging by 4.30% since the last trading session. Currently, the coin is trading at $0.01758 with a 24-hour trading volume of $13,235,953 and a 10-day average volume of $187,459. The market capitalization of ZIL is around $279,090,033, with a current circulating supply of 15,867,699,447 ZIL coins. It has a maximum circulating supply of 21,000,000,000 ZIL coins.
Technical Analysis on 1-Day Timeframe
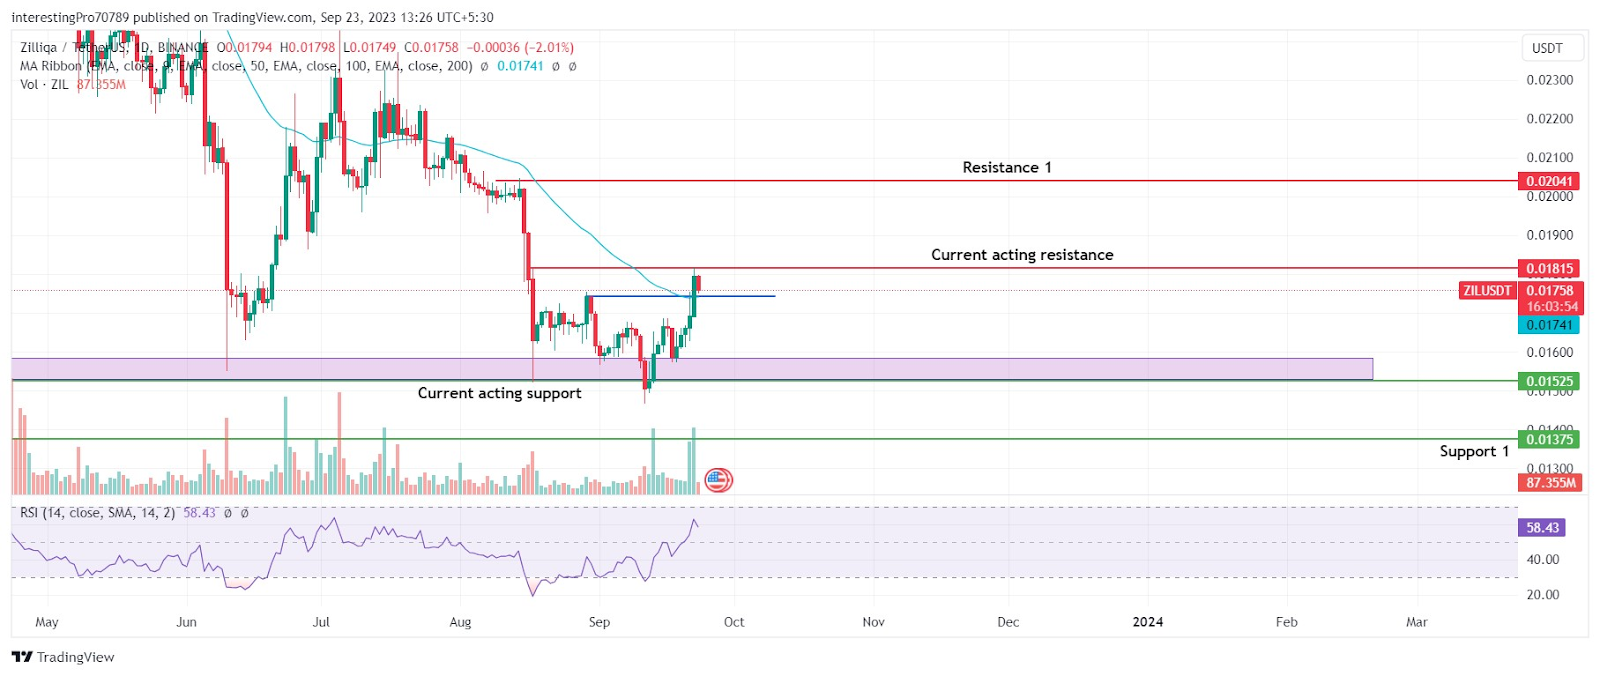
Source: Zilliqa / TetherUS 1D Chart by tradingview.com
In the 1 day chart, the price has given the breakout of the recent high or $0.01742 level and is currently sustaining above it. The price seems to be facing rejection from the $0.01825 level, which is making the price fall. price of coin has gone up from its support of $0.01525 forming higher highs.
The price has reached a breakout of 50 ema in the daily timeframe with a strong bullish candle. The relative strength index (RSI) is at 58.41, which is above the 50 RSI level, indicating the buyer’s presence over the price.
If the price gives a breakout of $0.01815, it can go up to its next resistance at $0.02040. However, if it breaks below the $0.01525 support zone, it may fall to its next support at $0.01375.
Technical Analysis on 4-hour Timeframe
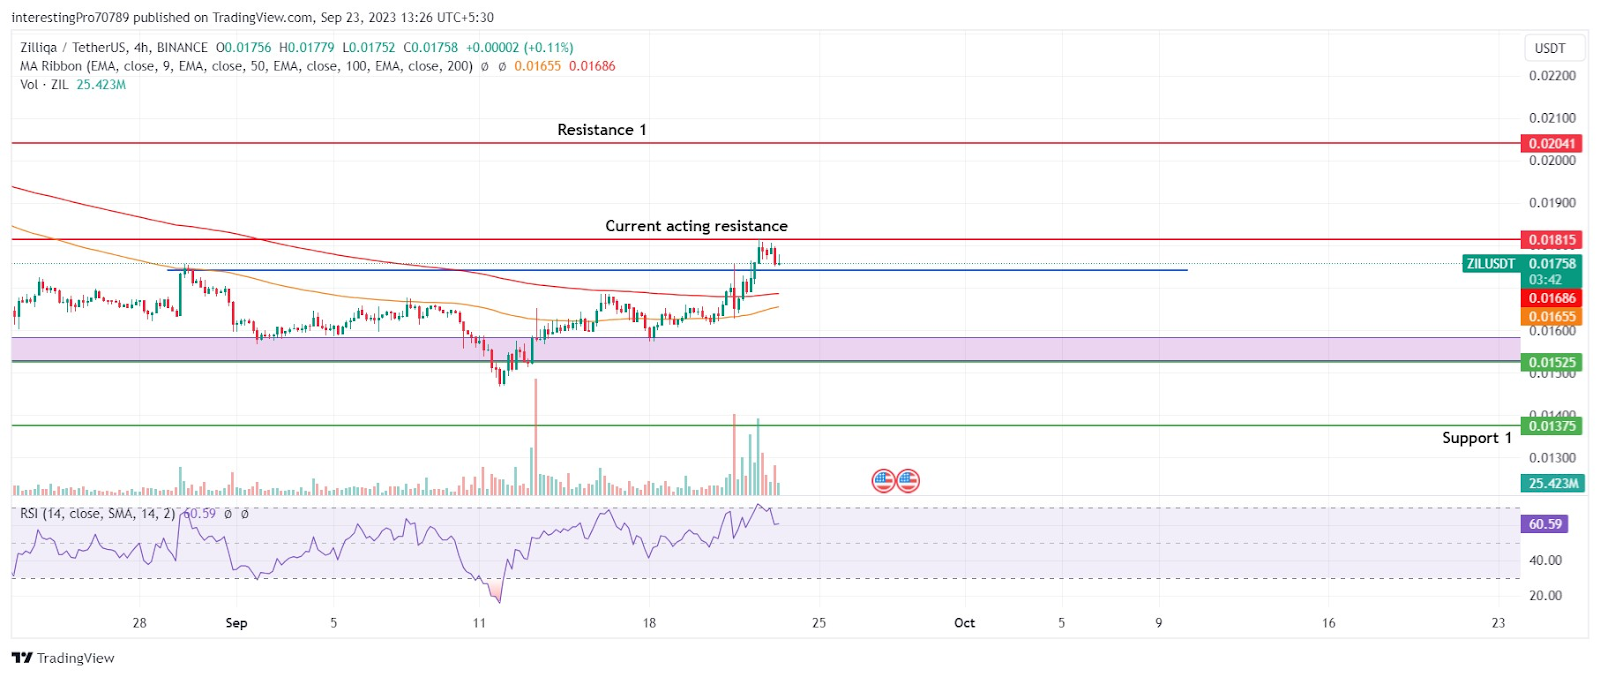
Source: Zilliqa / TetherUS 4H Chart by tradingview.com
In the 4-hour timeframe, the ZIL coin price has given rise to the breakout of the symmetrical triangle pattern. However, the price is facing rejection from the $0.01815 resistance.
The price is bullish in the 4-time frame as it is trading above the 100 and 200 EMA line. The relative strength index is at 60.59, which shows the RSI line is in bullish territory. The indicators indicate the buyers hold over the price.
Conclusion
The Zilliqa coin price is bullish and indicates the stronghold of buyers over it. Currently, the price is trading in a wide range of $0.01815 (current resistance) to $0.01525 (current support). If it gives a breakout of $0.01815, it can go up to its next resistance at $0.02040. However, if it breaks below the $0.01525 support zone, then it may fall to its next support at $0.01375.
Technical levels
Resistance Levels: $0.01815 and $0.02040.
Support Levels: $0.01525 and $0.01375.
Disclaimer
The views and opinions stated by the author or any other person named in this article are for informational purposes only. They do not provide financial, investment, or other advice. Investing in or trading crypto assets comes with a risk of financial loss.




