
 Zerebro
 Bitcoin
 Pudgy Penguins
 NEAR Protocol
 Quantus
 Pearl
Pearl ZKsync
- The C share price is currently consolidating inside a range.
- The sellers seem more active than the buyers and are waiting for the price to close below the $40.00 level.
Citigroup Inc. (NYSE: C) is an investment Bank and financial service-based American company. The company deals in the provision of financial products and also provides financial services.
Citigroup Inc. (C) Stock: Technical Analysis
The C share price is trading at $40.50. In the last two trading sessions, the price has declined by 2.24%. The current market capitalization of the company’s share price is at 77.991 billion USD. This company’s stock price has traded with a volume of $16.179 million in the last trading day.
Are Sellers Active On 1-day Chart of C Stock?
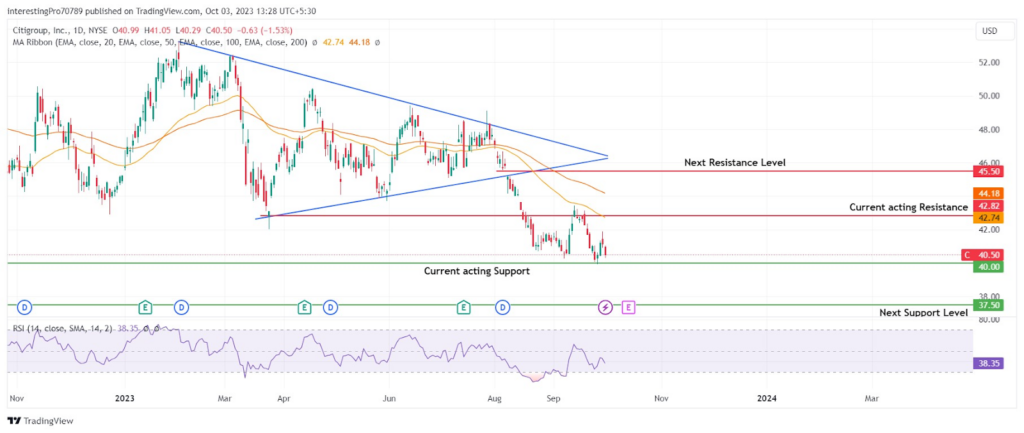
In the current scenario, the price is trading inside a range of $42.82 to $40.00. The price has recently formed two bearish candles and has engulfed the bullish candle formed just before it. It shows the sellers are very active at the current level and are trying to make the price fall.
The 50 and 100 EMA are trending in the downward direction and the C share price is trading below them. It indicates the sellers are currently active in the current scenario. Recently, the price has also taken resistance from the 50 EMA and has continued its fall.
The RSI line is below 50 and is trending in a downward direction. The RSI shows that it is in bearish territory and the sellers are the ones controlling the C price at the time of writing. The downward sloping of the RSI line shows the room left for sellers on the downside to make the price fall.
The recent price movement shows that it is in a bearish trend. It is consolidating in the range of $42.82 to $40.00 after giving the breakdown of the $48.8 level and is sustaining above the $40.00 support. The sellers have more control over the price compared to the buyers. If sellers make the price break below the $40.00 support, it may fall to its next support at $37.50.
However, for the price to be bullish it should reclaim the $42.82 level and have to sustain above it. Thus, the price could rise to its resistance at $45.50.
Conclusion
The Citigroup stock is bearish. The price is currently trading inside the range of $42.80 to $40.00 near its $40.80 support. If the price breaks below $40.00, it could fall to its next support at $37.50 by continuing its bearish trend. However, for the price to be in bullish sentiment it must reclaim its broken level of $42.80. Then it may rise to its resistance at $45.50. The indicators mentioned above for the price analysis of the C stock price are currently pointing toward the bear market.
Technical levels
Resistance Levels: $42.80 and $45.50.
Support Levels: $40.00 and $37.50.
Disclaimer
The views and opinions stated by the author or any other person named in this article are for informational purposes only. They do not provide financial, investment, or other advice. Investing in or trading comes with a risk of financial loss.



