
 streamoors
 IGNITION
 no crying in the casino
 Sword Inu
 Altai the Tiger
 NEAR Protocol
 Quantus
- Coca Cola share price is currently trading at $55.48.
- The price has recently given the breakdown of the $57.50 level and is approaching to its $54.50 support.
The Coca-Cola (NYSE: KO) was established by Griggs Candler on 8 May 1886. The company produces, manufactures, and markets non-alcoholic beverages they produced.
Coca-Cola Co. (KO) Stock Technical Analysis
The company stock is trading at $55.48 with a decline of 0.89%, which it faced in the last trading session. The firm’s current market capitalization is 239.915 billion USD and trades with a 10-day average volume of $13.12 million. In the last trading session, the stock price traded with a volume of $11.793 million.
Technical Analysis On 1-Day Timeframe Of KO Stock
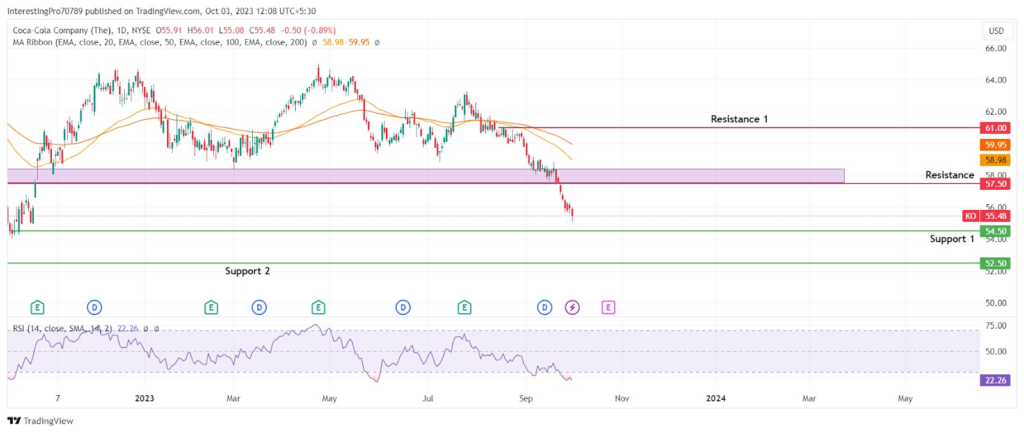
The KO 1-day chart shows that the stock price has given the breakdown of the $57.50 support level and is approaching its $54.50 support. The share price has declined by 3.81% since it has given the breakdown of the $57.50 support level.
The EMA lines have started to trend in the downwards direction and the price is also trading below the 50 and 100 EMA lines. It indicates the price is under the control of the sellers. However, the stock price trading far from the EMA lines, indicates a short-term pullback can happen. The KO stock price could rise to test the EMA lines.
The RSI has reached the oversold territory, indicating that a pullback or short-term recovery is due in the KO chart.
The company share price has almost reached its $54.50 support with strong selling pressure. The indicators are pointing toward the short-term recovery in the price. As the RSI is in oversold territory and EMA lines are trading a little far from the price.
This could lead the price upward and retest the $57.50 level again. If the price at the time of retesting forms a strong bearish candle after facing rejection from the $57.50 level, then it could again fall to its $54.50 support. If it gives the breakdown of the $54.50 support, the price could be seen at its next support at $52.50.
However, at the time of recovery the stock may rise towards its resistance at $61.00. The price has to reclaim the $57.50 level and sustains above it by forming a strong bullish candle to increase the stock price.
If the price fails to reclaim the $57.50 broken level or fails to give the breakdown of the $54.50 support level, it could consolidate between $57.50 to $54.50 levels.
Conclusion
The KO chart shows the bearish sentiment over the price. Recently, the price has given the breakdown of the $57.50 level. The indicators show that short-term recovery could happen in the upcoming trading sessions. If the price at the time of recovery reclaims the $57.50 level and sustains above, it could rise to its resistance at $61.00.
Suppose the price forms a strong bearish candle at the time of retesting the $57.50 level, it could fall to its $54.50 support again. If it also gives the breakdown of the $54.50 support, the next stop for the price would be at $52.50 level. Until any of those activities happened the price can trade inside a range of $57.50 to $54.50.
Technical levels
Resistance Levels: $57.50 and $61.00.
Support Levels: $54.50 and $52.50.
Disclaimer
The views and opinions stated by the author or any other person named in this article are for informational purposes only. They do not provide financial, investment, or other advice. Investing in or trading comes with a risk of financial loss.



