
 streamoors
 IGNITION
 Quantus
 Sui
Sui Zcash
Zcash Ethereum
 Pearl
Pearl
- Cambium Network Corporation stock price is trading at a 52-week low level.
- Cambium Network Corporation stock has been downgraded by Oppenheimer’s analyst.
- CMBM stock price surged by over 14% in the last trading session.
The current market price of the CMBM stock is $5.78.
CMBM stock price has declined a lot since the beginning of this year. The stock price has witnessed the sheer dominance of the bears on every level this year. This firm has witnessed a massive decline in its net income. A decline of over 213% (YoY) in the previous quarter was noted, which is a very negative sign for the company.
The stock price started a downtrend in the middle of the year 2021. Since then, the stock price has melted down over 90% of the gains. The major reason could be the poorly performing financials. Rating firm Oppenheimer has downgraded the stock with a target price of $10. The target price was revised from $15 to $10.
CMBM share price has declined by 20% in a week, 33% in a month, and 67% in a year. The stock price has reacted sharply to the news of different rating firms cutting down the target price. The reason for this might be an overestimated future financial growth of the firm.
Overview of the CMBM Stock Chart
CMBM stock price gave a breakdown from the symmetrical triangle pattern. The stock price formed some big gaps on the chart at various levels. The stock has formed a big gap between the level of $12.06 and $16.06. If one looks at the other gap, then it is present between the levels of $5.88 and $7.57.
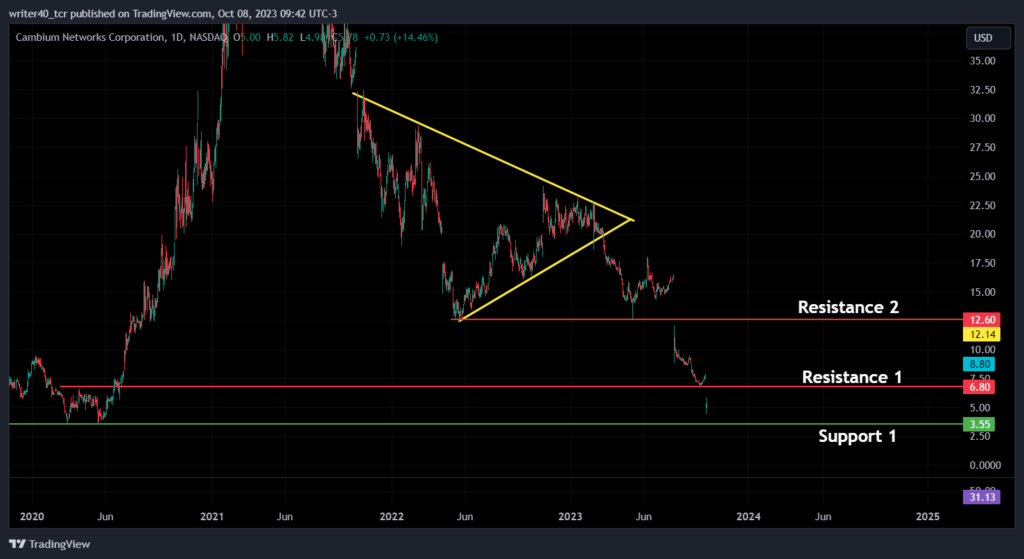
CMBM stock’s price is trading very close to the support level of $3.55. This level has given a strong surge to the price back in 2020. The resistance level for the price is present at the level of $6.80. Another resistance is present at the level of $12.60 respectively.
What EMA and RSI Indicators Are Saying?
Exponential Moving Averages
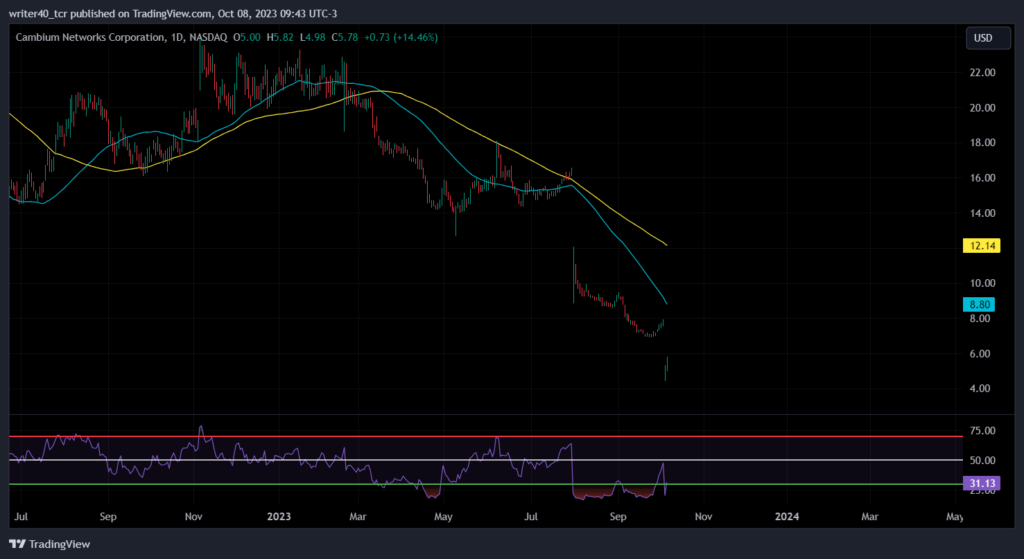
The stock price is trading way below the 50-day and 100-day exponential moving averages. The EMA’s slope is looking super bearish, as the slope is curving sharply down.
Both the EMAs are present at the level of $8.80 and $12.14.
Relative Strength Index
If one observes the relative strength index, then it can be said that the RSI is showing that the price is heavily bearish. However, the RSI has shown an oversold trajectory multiple times but it did not halt the price to fall. Currently, the RSI is placed at 31.13 level.
Conclusion
After being re-rated by multiple rating firms, the stock has witnessed a massive decline from the upper levels. If the price rises from this level, then the $6.80 level can provide some liquidity to the price. If the price starts declining from this level then it can witness some demand near the $3.55 level.
Technical Levels
Resistance Levels: $6.80 and $12.60
Support Levels: $3.55
Disclaimer
The views and opinions stated by the author, or any people named in this article, are for informational purposes only. They do not establish financial, investment, or other advice. Investing in or trading crypto assets comes with a risk of financial loss.



