
 Altai the Tiger
 IGNITION
 streamoors
 NEAR Protocol
 Sui
Sui Ethereum
 Pudgy Penguins
- Oriole Resources(ORR) is a British gold exploration company. It is an AIM (Alternative Investment Market) listed company. The company operates in Africa and Europe.
- The company was founded in 2005 by Timothy Livesey. ORR stock is listed on the LSE.
- ORR analysis will be done with the help of technical indicators and information will be provided through fundamental analysis.
Oriole Resources (LON: ORR) currently holds a market capitalization of £3.57 million, reflective of its standing in the financial market. Unfortunately, the company’s financial performance in the 2021 fiscal year did not fare well, and this trend continued into 2022. Presently, ORR’s market price hovers around 0.0976 GBX. Reviewing the company’s financials, in 2022, Oriole Resources reported a revenue of £115k, marking a decrease when compared to the figures from the 2021 financial year. Furthermore, the firm recorded an operating loss of £2.52 million in 2022, signifying an increase from the previous fiscal year.
On a positive note, the net loss for 2022 was £1.62 million, which exhibited a decrease compared to 2021 figures. However, ORR stock experienced a significant decline, with a 98% decrease in the most recent year, an 81% decrease over the past five years, a 42.65% decrease in the preceding year, and a 30.36% decrease over the past six months.
Technical Analysis of ORR
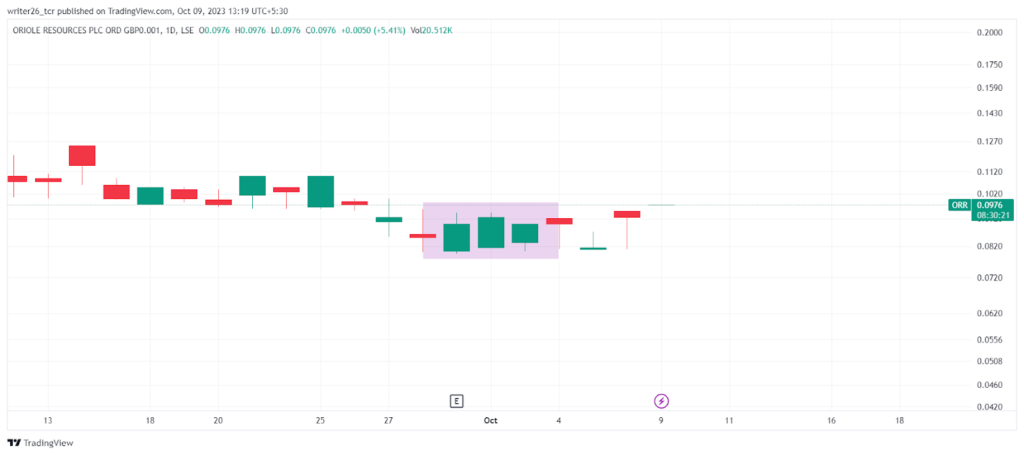
The pattern shown on the chart is known as a bullish pattern. It confirms that the prices will continue to go down in the daily time frame. As we can see the price fell in place of rising. This pattern appears when the stock is in a downtrend and indicates that ORR stock’s price will fall in the future after its formation.
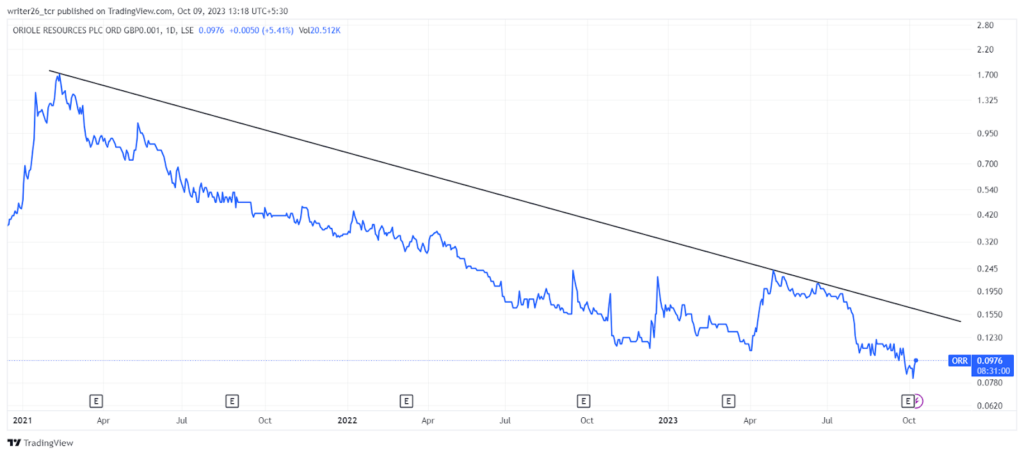
This stock has displayed a clear pattern of resistance along a persistent downtrend line, reinforcing its downward trajectory since 2021. The bearish momentum has remained a dominant feature, signified by the ongoing descent. Notably, on February 10, 2021, in the daily time frame, ORR shares achieved their all-time high (ATH) at approximately 1.955 GBX. However, recent performance shows a modest 5.41% increase today, suggesting a brief positive streak in the last few trading sessions. Nonetheless, a broader view in the daily time frame analysis reveals continued challenges, with the share seeing a marginal rise of just 0.01 GBX today.
SMA and EMA (50,100,200)
Simple Moving Average(SMA)
SMA 50- £0.1081 (Sell)
The SMA 100- £0.1481 (Sell)
SMA 200- £0.1516 (Sell)
Exponential Moving Average(EMA)
EMA 50- £0.1137 (Sell)
The EMA 100- £0.13210 (Sell)
EMA 200- £0.1524 (Sell)
Live Chart of ORR
Conclusion
Both technical and fundamental analysis point to a lack of strength in this stock for investment purposes. Over the course of the last day, the stock has maintained a persistent downward trend. In contrast, recent performance over the last five days shows a noteworthy 21.57% increase, but the previous month exhibited a significant 18.75% decline. Overall, ORR stock does not appear favorable for either long-term or short-term investments at present. Investors considering ORR should exercise caution and may want to wait for signs of a recovery before considering an investment.
Technical Levels
Support level- GBX- 1025
Resistance level- GBX- 1155
Disclaimer
This is a general article that does not provide any financial information. Investors should focus on both technical analysis as well as fundamental analysis. The analysis is done to provide information to readers. To make them aware of investments. All the data is fluctuating due to stock market hours. It might change when readers read the article.



