
 Altai the Tiger
 Sword Inu
 streamoors
 IGNITION
 NEAR Protocol
 Pearl
Pearl Injective
- Paramount Global’s stock price has decreased by -1.83% in today’s market session.
- The earnings of the company have declined in the previous quarters.
- Paramount Global’s stock price fell by nearly -42% in the last year.
Paramount Global (NASDAQ: PARA) functions as a multimedia enterprise, delivering content across diverse platforms to global audiences.
Trend Analysis
The ongoing trajectory of Paramount Global stock is indicating a continuous downward trend, marked by the establishment of new lower price levels. The technical summary for PARA stock is displaying a bearish signal. Among the top 26 indicators, 16 are signaling a ‘sell’, while only 2 are suggesting a ‘buy.’ Additionally, the moving averages summary indicates a ‘strong sell’ signal, highlighting the stock’s current underperformance.
The dividend payout ratio for PARA stands at -41%. This negative dividend payout ratio implies that the company is paying out more in dividends than it is earning, potentially impacting its financial stability and indicating the likelihood of a future price decline.
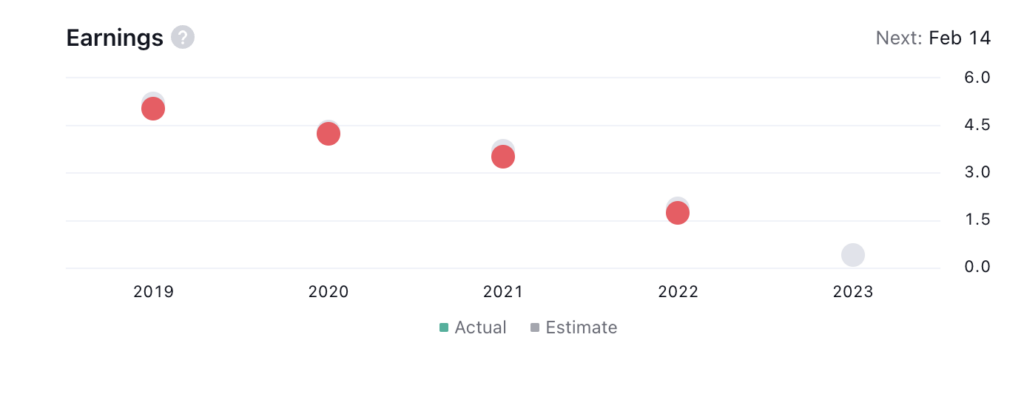
The company’s earnings declined in the past year, falling 8% below the expected earnings for 2022. This decline underscores the weakness in the stock, further contributing to its downward trajectory.
PARA stock has delivered a negative return of approximately -42% over the past year, signifying the stock’s poor performance. In March 2021, Paramount Global (PARA) stock reached its peak at $101.97. However, after reaching this high point, the stock entered a consistent downtrend. By the end of November 2022, the stock had declined by nearly 85%, ultimately reaching an all-time low. It is currently trading near these historically low levels.
Currently, the price of PARA is contained within a descending wedge pattern. This pattern suggests weakness, indicating the overall fragility of the stock’s structure and forecasting a potential future price decline.
Paramount Global Inc. (PARA) Stock Price Analysis
Upon conducting a more detailed analysis of the technical indicators, it becomes apparent that both the signal line and the MACD line for PARA stock are situated below the zero line. Furthermore, the presence of a red histogram indicates the prevailing downward pressure on the stock price.
The positioning of the RSI and the 14-day SMA lines for PARA stock shows their proximity to the 30 level. This alignment signifies that both indicators are within the negative zone, suggesting the potential for price declines in the days ahead.
Conclusion
In conclusion, the PARA stock price is moving in a downtrend. The stock has given a negative return in the previous year along with the price forming a fresh all-time low. The indicators are negative for the stock and the overall structure of the stock is weak. Hence, the price is likely to decline in the upcoming days.
Technical Levels
- Support Level: $9.7 and $8.5
- Resistance Level: $14 and $19
Disclaimer
The views and opinions of the author, or anyone named in this article, are for informational purposes only. They do not offer financial, investment, or other advice. Investing or trading crypto assets involves the risk of financial loss.



