
 streamoors
 Celestia
 Injective
 Pudgy Penguins
 Pearl
Pearl NEAR Protocol
 Quantus
- TRON coin price increased by over 104% last year.
- TRX has a circulating supply of 88 Billion coins.
TRON (TRX) stands as a decentralized blockchain operating system created by the Tron Foundation in 2017. Initially, TRX tokens were ERC-20 tokens on Ethereum but later transitioned to their independent network.
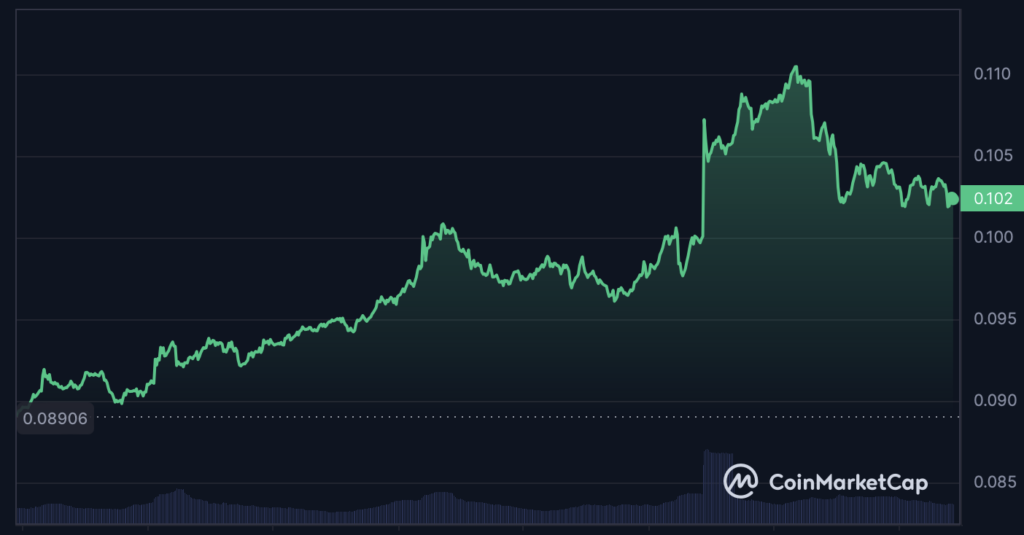
The TRON coin is trading at $0.10 which declined by nearly 1.74% in the last 24 hours after the huge surge. The coin has a total circulating supply of 88 Billion coins.
The price of the TRX coin increased by over 10% in the previous year. The coin has a market cap of $9.07 Billion and a volume/market cap of 0.03. The coin has a market cap rank of #10.
TRON (TRX) Technical Analysis
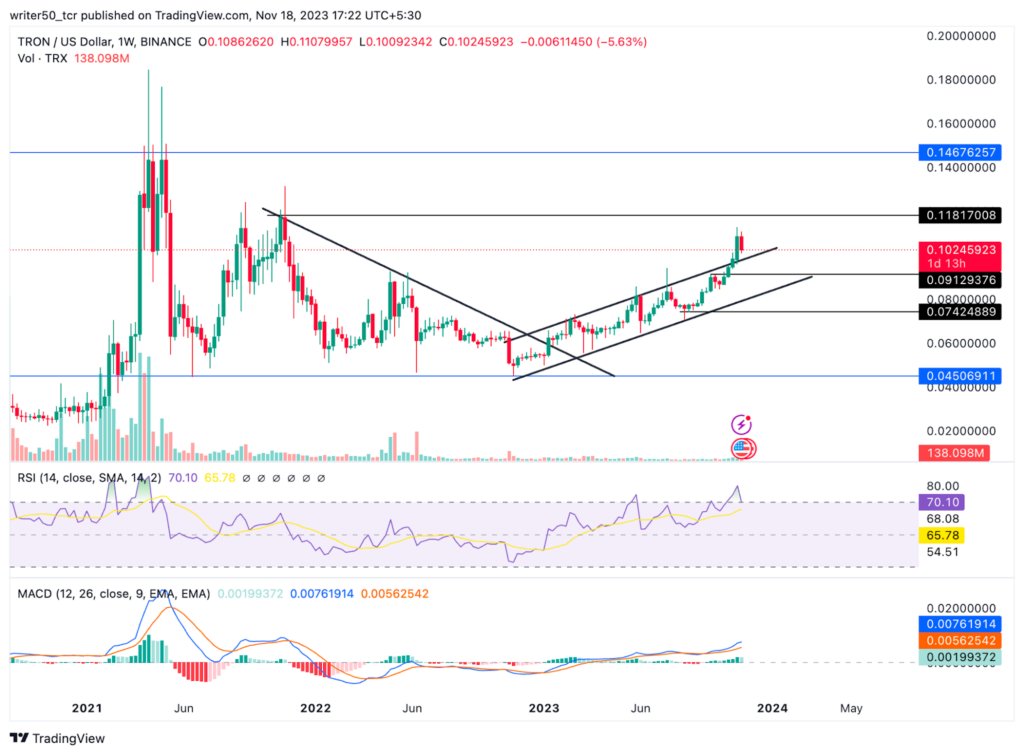
The TRON (TRX) coin exhibits an upward trajectory on the weekly timeframe, characterized by the establishment of a higher high pattern. A glance at the charts reveals a notable surge of over 154% from the swing low, indicating a remarkable recovery for the coin.
The price of the TRX was moving inside the rising channel pattern. However, recently, the price has shown a breakout from the channel and is now moving upwards.
The overall structure of the coin is positive and the price is expected to rise further if it breaks above the resistance level of $0.118.
Technical Indicators Outlook About TRON
The MACD line in TRX is positioned above the signal line, indicating a positive crossover in the price. Additionally, the emergence of a green histogram reinforces a favourable signal.
In the weekly chart, the RSI line for TRX is at 64, with the SMA line close to the 70 level. The RSI line’s positioning above the SMA line is deemed a positive signal, further suggesting an upward trend in the price.
Conclusion
The analysis reveals that the price of the TRON coin is moving upwards and the price has shown a breakout from the rising wedge pattern. The price will additionally show a further rise if it moves above the resistance level of $0.118.
The indicators are also showing a positive signal and it has shown an impressive recovery after hitting the swing low. Thus, the price is expected to rise in the upcoming days.
Technical Levels
- Support Levels: $0.091 and $0.074
- Resistance Levels: $0.118 and $0.146
Disclaimer
The views and opinions of the author, or anyone named in this article, are for informational purposes only. They do not offer financial, investment, or other advice. Investing or trading crypto assets involves the risk of financial loss.




