
 Altai the Tiger
 Sword Inu
 streamoors
 IGNITION
 NEAR Protocol
 Pearl
Pearl Injective
- Technical tools and EMAs are showing bearish traits, in the BTC price chart.
- The BTC was trading at $42119, which declined by 0.05% in the last 24 hours and the 24-hour volume was 23.739 Billion (press time).
BTC has started to show signs of weakness, as a few days back, the price retreated from a critical level of around $44350 on the chart. The crypto seems like it is about to take a big slump, as it ran into a very sturdy resistance level and tumbled from the earlier support zone area.
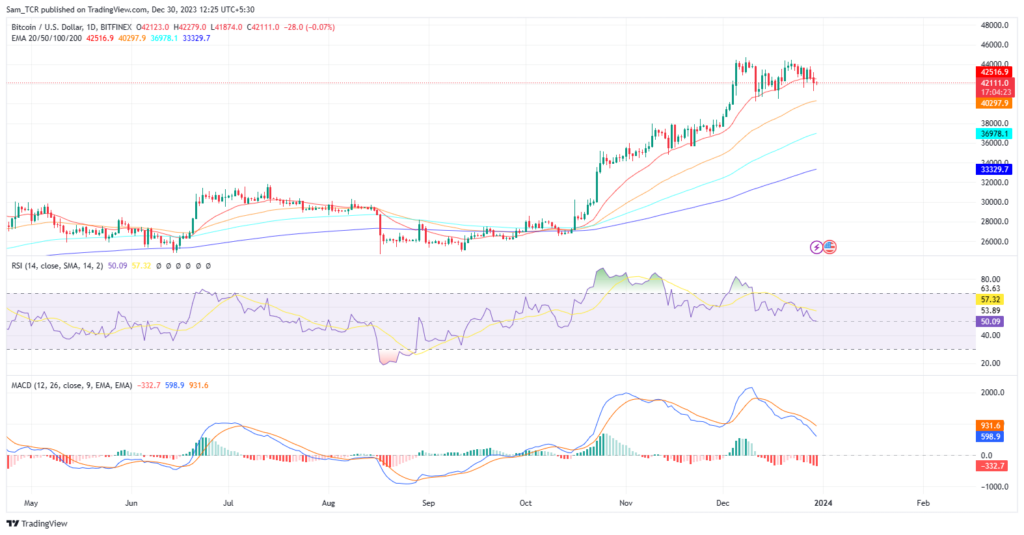
The BTC asset is now displaying bearishness and a falling tendency as it plunges below the 20-day EMA. Now, reliant on the sellers’ surge, the BTC price may correct further and reach other supporting EMAs as well.
The RSI is at 50.13 and faced rejection from the 14 SMA, which is at 57.32. The indicator is yet to come close to the 30 level, implying that Bitcoin is not facing significant buying pressure yet and could continue to fall and reach a lower support level.
The MACD line is at 598.9 and the signal line is at 931.6, these numbers portray bearishness and highlight a broadening bearish crossover. This means that the Histogram width is widening and can widen further in the near future as well.
Overall, technical tools and trends highlighting EMAs show bearish traits.
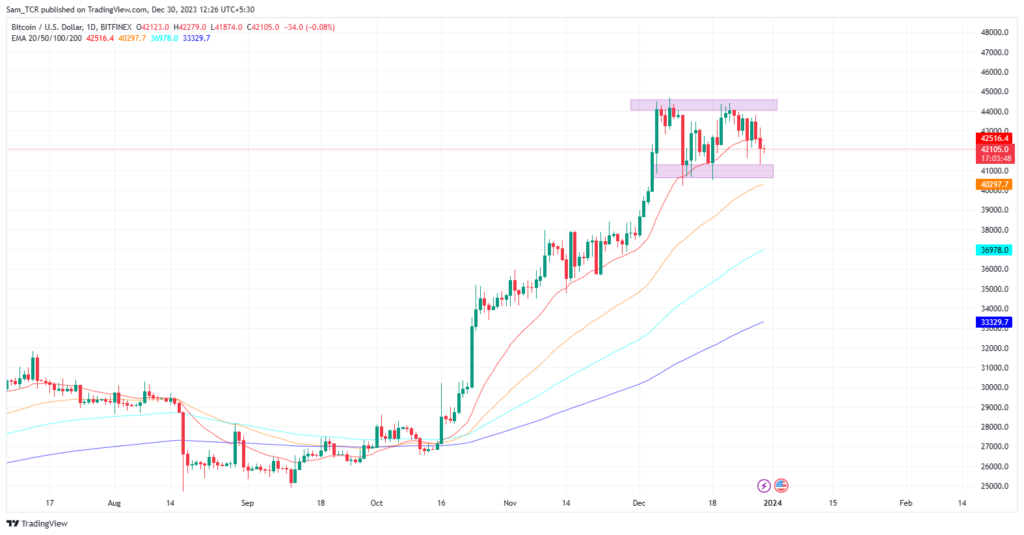
At the time of publishing, the BTC was trading at $42119, with a 0.05% decline over the last 24 hours. The last 24-hour volume was 23.739 Billion, market capitalization is nearly around $825.425 Billion, and the circulating supply is nearly around 19.584 million.
Therefore, if the BTC price fails to stay above the $41700 level, it could decline further and reach major support at $40500.
On the flip side, if the demand for bitcoin surges again from the current level, then the asset price could advance more from the current level. Then the next resistance for the price could be $43200, and the major resistance would be $44200.
Summary
The BTC has started to show signs of weakness and deterioration, as the price retreated from the critical level of around $44350 on the chart. The EMAs are showing bearish traits. Therefore, if the BTC price fails to stay above the $41700 level, it could decline further and reach the major support level of $40500. The technicals are not giving strong signals – RSI and MACD are heading downwards.
Technical Levels
Support Levels: $40500
Resistance Levels: $44200
Disclaimer
In this article, the views, and opinions stated by the author, or any people named are for informational purposes only, and they don’t establish the investment, financial, or any other advice. Trading or investing in cryptocurrency assets comes with a risk of financial loss.




