
 no crying in the casino
 IGNITION
 Hood Sword Inu
 streamoors
 Altai the Tiger
 Sword Inu
 Pearl
Pearl
- Relative Strength Index (RSI) is a momentum oscillator technical indicator.
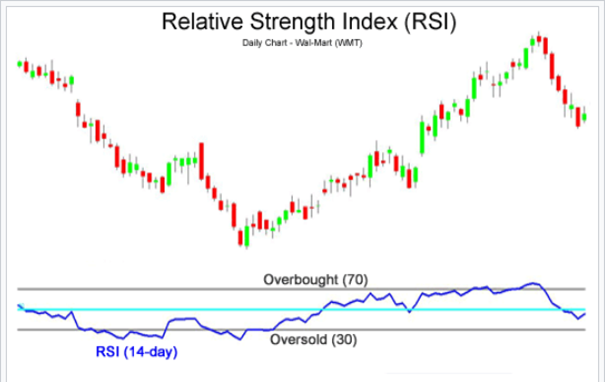
- It lies in the range of 0 to 100, with 30 and 70 being oversold and overbought levels respectively.
Traders use several technical indicators to predict the direction of the market and learn their entry and exit points. Relative Strength Index (RSI) is one such technical indicator that comes under the momentum oscillator class. A momentum oscillator gives results based on the change in the magnitude of the price of an asset in a given period. With RSI, a trader can compare the average gain and average loss associated with an asset and predict its strength or weakness in the coming period.
Calculating RSI
Before going into the calculations, we assume 14 days. Among these days, the security generated positive returns for 10 days and negative returns for 4 days. Using 14 days is standard practice, however, an analyst may decide any number of days they wish. There are two steps involved in calculating RSI:
First Step:
Use the following formula to get RSI1.
RSI1 = 100 – [ 100 / ( 1 + Avg. gain / Avg loss)]
Average Gain
Calculate the average profit for each of the 10 days with positive returns and after adding all the profits, divide the sum by 14. This gives the average gain for 14 days.
Average Loss
Calculate the average loss for each of the 4 days with negative returns and after adding all the losses, divide the sum by 14. This gives the average loss for 14 days. Note that a positive value for the average loss has to be used in the formula.
Substitute the values in the formula to get RSI1. This value is then made smooth and an RSI2 is calculated, so that it lies between 0 and 100, and is easy to analyze by an analyst.
RSI2 = 100 – 
Here, we add the daily average profit for the 10 days and multiply it by 13. Then add today’s gain, if any, and divide the result by 14.
Similarly, add the daily average loss for the 4 days and multiply it by 13. Then add today’s loss, if any, and divide the result by 14. Substitute the values to get RSI2 or smoothed RSI. This indicator is then plotted below the price chart to infer the results.
Results from RSI
Overbought and Oversold
The RSI value lies between 0 and 100. An RSI value of zero means that the asset’s price has fallen all 14 days and a value of 100 means the asset’s price has surged all 14 days.
The levels of 70 and 30 are known as overbought and oversold levels respectively, and are considered as trend reversal indicators. Overbought means that the asset’s price was above its market price and after hitting 70, it will undergo a reversal and traders will want to sell.
Oversold means that the asset’s price was less than the market’s price and after hitting a level of 30, it will experience a reversal and traders will want to buy. However, these levels are traditionally considered as standards and may be varied according to the volatility of the stock and better fit it.
Divergences
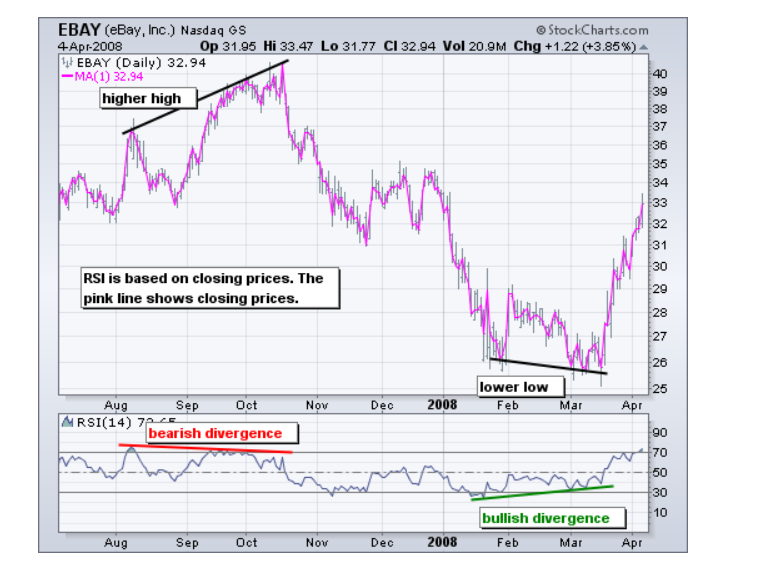
Divergence occurs when there is a conflict between the prediction by RSI and the actual price movement. A bullish divergence occurs when the RSI forms higher lows but the price indicates lower lows. A bearish divergence occurs when the RSI forms lower highs but the price movement indicates higher highs. However, these divergences are temporary and the RSI later catches up with the price trend.
Reversals
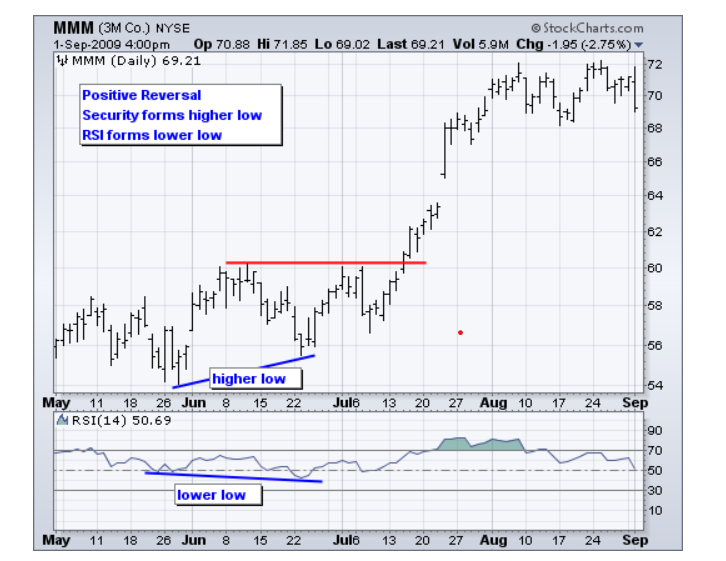
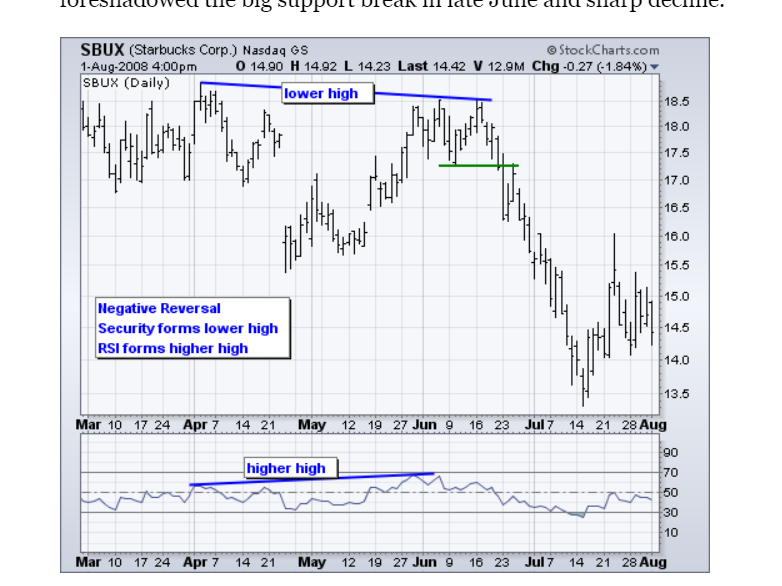
Analysts also look upon RSI for positive and negative reversals to get buying or selling signals. A positive reversal takes place when the RSI forms a lower low but the price indicates a higher low. Lower low means that the next dip is lower than the previous dip and higher low means that the next dip is higher than the previous dip.
A negative reversal occurs when the RSI indicates a higher high but the price forms a lower high. Higher high means that the next rise is higher than the previous rise and lower high means that the next rise is lower than the previous high.
Final Thoughts
RSI is a powerful indicator and is used widely by analysts. However, RSI is not a standalone indicator and performs best when combined with other technical indicators like moving averages. This ensures correct trend signals instead of false alarms. Based on the personal strategy and goals, RSI can be used in several time frames like weekly, daily, hourly, or minute charts. This indicator can also be used in the side-ways or non-trending market.




