
 streamoors
 Altai the Tiger
 Sword Inu
 IGNITION
 no crying in the casino
 Quantus
 Pearl
Pearl
- The Hedera price has dropped by 17% in the past 24 hours.
- Hedera’s price has fallen by 85% from its all-time high.
On a wider time frame, the Hedera (HBAR) price has been in a downtrend but in the short term, bulls are dominating. Currently, the HBAR price is facing strong rejection from the last swing high.
The circulating supply is 33,627,884,869 HBAR and the maximum supply and total supply is 50,000,000,000 HBAR. The fully diluted market cap is $4,323,375,844.
Analyze the short-term and medium-term Hedera price prediction and check the long-term price forecast for 2025, 2031, and beyond.
Current Price – $0.0862 (-11.18%) Price Prediction – $0.0802 (-7.82%)
Sentiment – Bullish Fear & Greed Index – 70 (greed)
Market cap – $2.91 billion Green Days – 19/30 (63%)
Volume – $206.22 million 200-day EMA – $0.0631
Volatility – 11.14% RSI – 53.76
According to our analysis, the Hedera price is predicted to drop 7.82% to reach $0.0802 by January 08, 2024. The volatility is 11.14% and the fear and greed index is 70 (greed). The HBAR price has performed bullish for 19 days in the last 30 days, which indicates the bullish grip.
Long-term Hedera Price Prediction For 2025, 2025, 2026, 2027, 2028, 2029, 2030, and 2031
| Year | Yearly Low | Yearly High |
| 2025 | $0.0679 | $0.1044 |
| 2026 | $0.1014 | $0.2945 |
| 2027 | $0.0735 | $0.1785 |
| 2028 | $0.0766 | $0.1014 |
| 2029 | $0.0432 | $0.1549 |
| 2030 | $0.1468 | $0.7642 |
| 2031 | $0.0558 | $0.3925 |
Based on the historical price movement of Heders, the price is predicted to range between $0.0679 & $0.1044 by next year. On the same basis, here is the price prediction for each year till 2031.
Technical Indicators
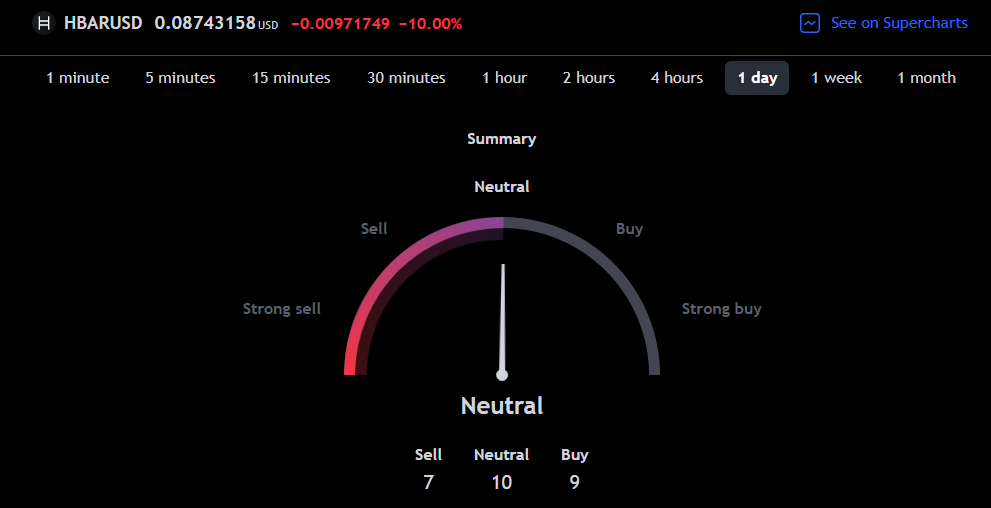
On a daily time frame, the Hedera price is predicted to be neutral because 10 technical indicators are signaling neutral momentum, 7 are signal selling momentum and 9 are signaling buying signal.
Oscillators v/s Moving Averages
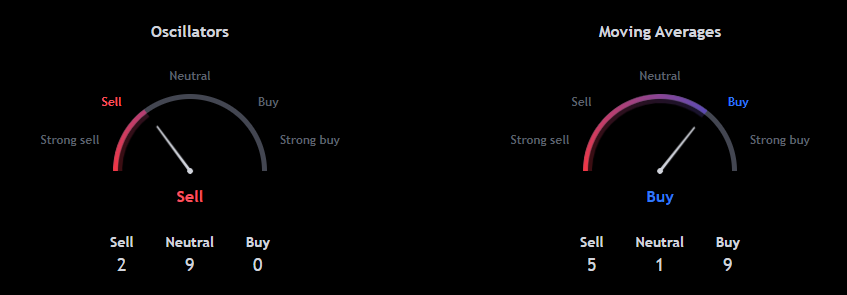
Here oscillators are favoring selling momentum but moving averages are favoring buying momentum.
Hedera Price Prediction
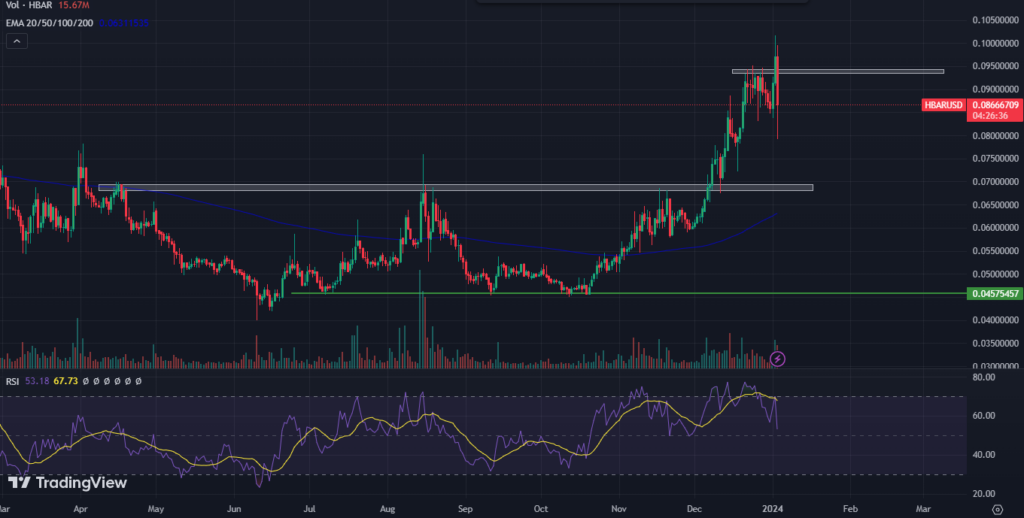
The HBAR price has surged by 70% since November, which indicates the bullish dominance. The Hedera price is near the last swing high and the price rejection can be seen.
If the HBAR price slips below $0.0800 and sustains, sellers may dominate and the price may decline further. On the other hand, if the HBAR price manages to surpass $0.1000, buyers may lift the price in the next few weeks.
Hedera Price Prediction Based on Technical Analysis
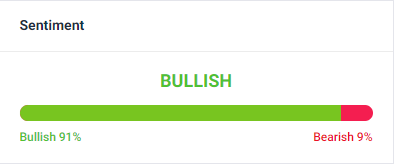
According to the data on January 03, 2024, the HBAR coin price prediction sentiment is bullish with 29 technical indicators favoring bullish momentum while only 3 favoring bearish momentum.
Hedera Price Prediction For Tomorrow and Next Week
| Date | Price | Change |
| Jan 04, 2024 | $0.0870 | 0.00% |
| Jan 05, 2024 | $0.0813 | -6.54% |
| Jan 06, 2024 | $0.0783 | -10.00% |
| Jan 07, 2024 | $0.0777 | -10.70% |
| Jan 08, 2024 | $0.0802 | -7.82% |
| Jan 09, 2024 | $0.0778 | -10.56% |
| Jan 10, 2024 | $0.0804 | -7.57% |
The Hedera price prediction for the next 7 days is based on the previous trends. According to our analysis, the HBAR price will perform negatively throughout the next week.
Hedera Price Prediction FAQs
What is the Hedera price prediction today?
The HBAR price is predicted to gain 0.00% to reach $0.0864 by today.
What is the HBAR price prediction tomorrow?
According to our analysis, the Hedera price will drop by 6.54% to reach $0.0814 by tomorrow.
What is the Hedera price prediction for 2024?
The HBAR price will gain 41.45% to reach $0.1208 by the end of 2024.
Will the Hedera price reach $1?
The Hedera price needs to gain 1,058.45% to reach $1. According to our algorithm, the price will hit $1 by January 2035.
Will the HBAR price reach $10?
The HBAR price would gain 10,584.50% to reach $10. Based on our analysis, the Hedera price will reach $10 by July 2042.
Will the Hedera price reach $100?
The Hedera price would gain 105,458.00% to reach $100. According to our algorithm, the HBAR price will hit $100 by September 2055.
Conclusion
The Hedera price has been in a strong downtrend and moving in a range. The HBAR price is trading over the significant moving average, which showcases a bullish trend. According to the analysts, the HBAR price will remain bullish till it sustains over 200-day EMA.
Technical levels
Resistance: $0.1000 & $0.1500
Support: $0.0700 & $0.0450
Disclaimer
Investing in cryptocurrencies and other Initial Coin Offerings (“ICOs”) is especially volatile and speculative, and this article does not advise investing in cryptocurrencies or other ICOs. Since everyone is unique, a certified professional should be continually consulted before making any economic decisions.




