
 streamoors
 Altai the Tiger
 Sword Inu
 IGNITION
 no crying in the casino
 Quantus
 Pearl
Pearl
- The Osmosis crypto price is struggling between the 20-day and 200-day EMAs.
- The OSMO crypto price has declined by 26% in the last 20 days.
In a daily time frame, the OSMO price has performed positively since November and has gained 300%. The Cosmos crypto price has been struggling below the $2 mark, and it has tried to surpass the $2 mark but couldn’t. On December 26, 2024, the Osmosis price was pumped by 65% in a few hours, and an all-time high of $2.56 was recorded. The trading volume surged by 1700% compared to previous days.
The OSMO price has faced resistance from the $1.80 mark and dropped by 27% in the last few days. The Osmosis crypto price has struggled between the 20-day and 200-day exponential moving averages for the previous few days.
Osmosis price is trading at $1.37 with an intraday gain of 1.14%. The market capitalization of Osmosis is $896.85 million, and the 24-hour trading volume is $35.44 million, which has dropped by 27%. The circulating supply is 651,267,737 OSMO, and the fully diluted market cap is $1.37 billion. The total supply is 998,281,040 OSMO, and the maximum supply is 1,000,000,000 OSMO.
Osmosis Crypto Price vs Volume Analysis
In February, the trading volume increased by approximately 600%, but the price remained constant. Since March, the trading volume has decreased from $750 million to $275, which has affected the price negatively. If the trading volume decreases, the price may slip below the 200-day exponential moving average.
OSMO Crypto Social Dominance and Social Volume Analysis
According to the graph, social dominance and social volume have been increasing slowly for the last few weeks, and the price has remained constant. If the awareness of Osmosis crypto increases in social volume, it may leave a positive impact on the price.
Osmosis Crypto Price Technical Analysis Over Daily Timeframe
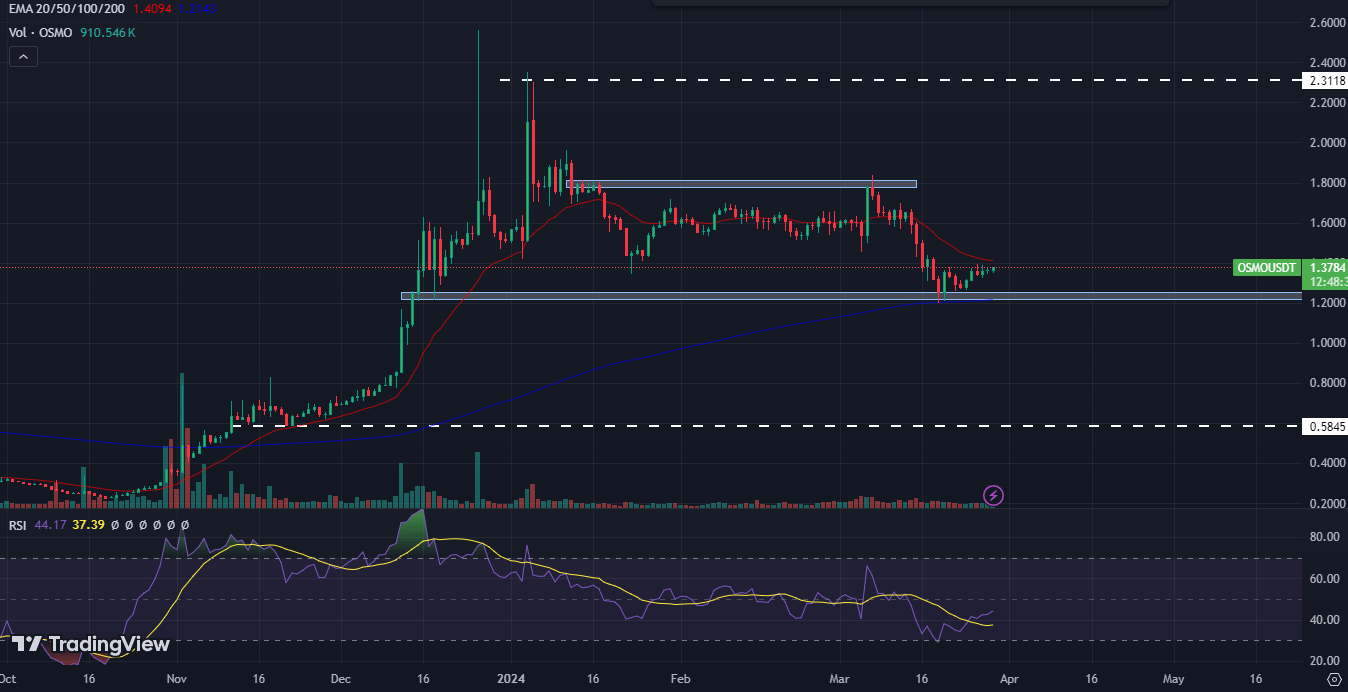
In a broader time frame, Osmosis crypto price has been struggling between $1.20 and $1.80 for the last few months. Currently, the OSMO price has melted to $1.20, and buyers seem to be active and defending the support level.
If the chart price attracts buyers and surpasses the 20-day exponential moving average, it may extend to the $2 mark. If the price sustains the $2 mark and trading volume increases, it may record a new all-time high.
On the other hand, if the OSMO price slips below the $1.20 level and sustains below the 200-day EMA, investors may prefer to book profit, which may lead to selling pressure. However, if the price fails to defend the $1 hurdle, it may erode the previous gains.
Based on the technical indicators, the Osmosis price is trading over the 200-day exponential moving average, indicating positive momentum. A bullish crossover has been generated between the RSI and RSI-based moving averages. The RSI is at 44, which has got elevation and is heading toward the overbought zone.
OSMO Crypto Price has Formed an Ascending Triangle on the 4-H Timeframe
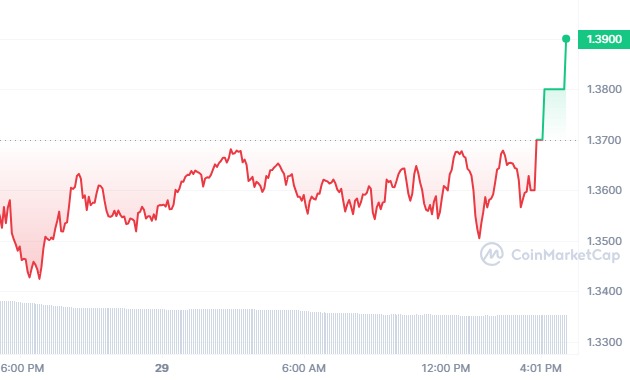
In a 4-H time frame, the OSMO crypto price has formed an ascending triangle pattern. If the Osmosis crypto price surpasses the resistance level of $1.40, it may look for the 200-day exponential moving average.
Alternatively, selling pressure can be initiated if the Osmosis price slips below the trendline and is sustained. Free-fall momentum can be seen if the price fails to defend the $1.20 level.
Conclusion
Since October 2024, the Osmosis crypto price has been bullish and recorded a new all-time high. The OSMO price has been struggling between $1.80 and $1.20 for the last few days. It has tried many times to sustain the $2 mark but failed. According to the analysts, the selling signal can be generated below the 200-day exponential moving average.
Technical Levels
Resistance: $1.70 & $2.30
Support: $1.25 & $0.81
Disclaimer
This article is for informational purposes only and provides no financial, investment, or other advice. The author or any people mentioned in this article are not responsible for any financial loss that may occur from investing in or trading. Please do your research before making any financial decisions.




