
 Altai the Tiger
 IGNITION
 streamoors
 Sword Inu
 NEAR Protocol
 Injective
 Quantus
- The trading price of the HBAR crypto has advanced by 55% in the last one year.
- The Hedera crypto has a very high inflation rate.
Hedera Hashgraph (HBAR) is an energy-efficient cryptocurrency powering the public Hedera network, offering fast transactions and low fees. Created by Dr. Leemon Baird and Mance Harmon, it utilizes a proof-of-stake mechanism for security, with a fixed supply of 50 billion coins. Staking HBAR earns up to 6.5% APY, ensuring network integrity.
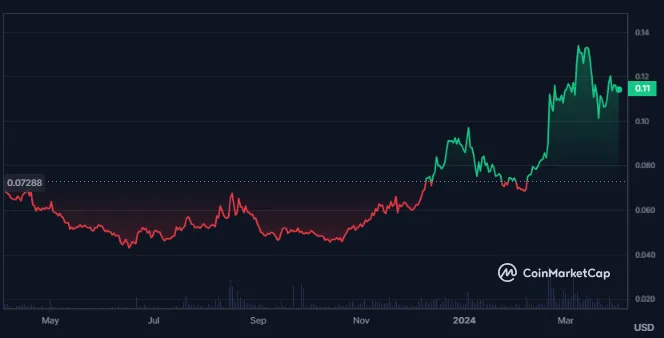
The fear and greed index for the Hedera crypto represents extreme greed as it is at 79 as per Coincodex. Also, the sentiment of the crypto is neutral and the volatility of the crypto is also high resulting in 7.0%.
Hedera has a market cap dominance of 0.14% which further results in a market cap of $3.68 Billion. Also, the fully diluted market cap of the crypto is $5.708 Billion which is followed by a circulating supply of 33.719 Billion HBAR.
The supply inflation of the Hedera is very high resulting in 127.33% which is followed by a similar amount of maximum supply and total supply of 50.0 Billion HBAR. Moreover, the circulating supply of the crypto is 67.44%.
The trading volume of the crypto has advanced by 32.7% in the last 24 hours which resulted in a traded volume of $61.265 Million followed by a volume/market cap ratio of 1.58%. Also, Hedera is the 36th largest cryptocurrency in the global cryptocurrency market.
The total value locked for the Hedera crypto is $120.65M and the stablecoins market cap of the crypto is $11.53 Million.
Hedera Crypto Derivatives Analysis
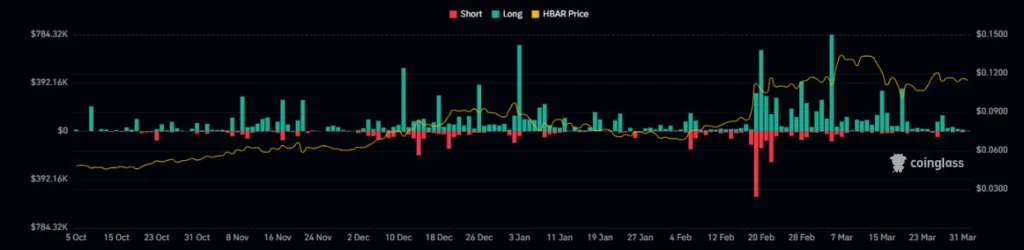
The derivatives data of the Hedera crypto indicate weakness as higher long liquidations can be seen on the liquidation charts over time. Also, in the last 24 hours higher long liquidation of $14.87K is recorded against short liquidations worth only $6.45K.
The derivatives trading volume further advanced by 42% resulting in a traded value of $49.58M over the last 24 hours. This further resulted in the advance of 3.8 in the open interest for the crypto.
Social Dominance Vs Development Activity
Although there is a significant decline in the social dominance of the crypto, there has been a huge surge in the development activity of the crypto which indicates the possibility of further upgrades in the Hedera blockchain.
HBAR Crypto Derivatives Analysis
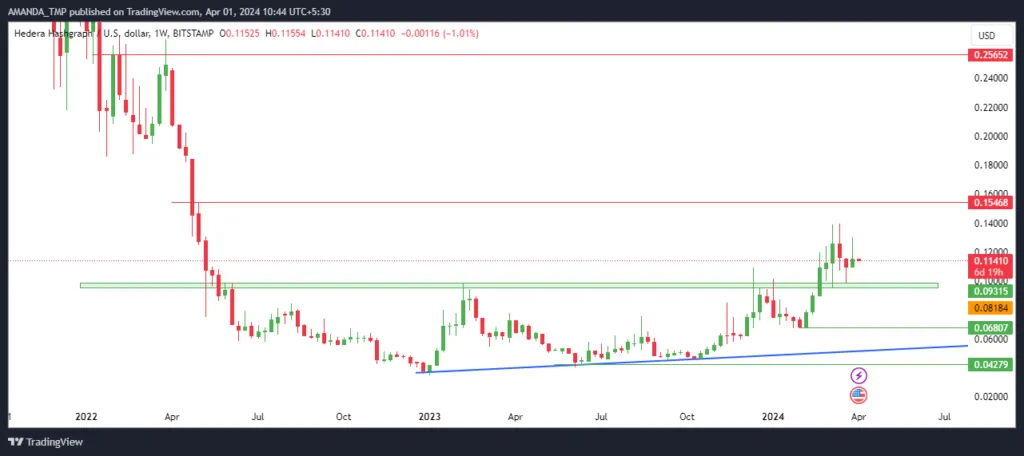
HABR crypto has broken above the crucial resistance level of 0.09880 and the price is currently sustaining above the same. The momentum of the crypto is very slow as the price is revolving around a small zone.
The following behavior of the price indicates accumulation after the breakout and if the price further breaks above the most recently formed swing high, a further surge in the HBAR crypto price to the next resistance level might be seen.
HBAR/USD Chart by TradingView
The EMAs reflect a bullish overview for the price as the 50-day and the 200-day EMAs are trading in a golden cross for a long time on the daily chart of the crypto. This is further followed by advances in the price of the crypto and the values of the EMAs over time.
The MACD and the signal line have declined to the zero level followed by a bearish cross of the metrics. The present scenario of the MACD indicator indicates weakness in the price of the crypto.
The RSI further follows a bullish cycle while it also has declined to the level of 47.7 from the overbought zone. If it further rebounds above the 50-level, a further surge in price might be witnessed.
Summary
The HBAR crypto has broken crucial resistance, sustaining above it with slow but accumulating momentum, potentially leading to a surge if it breaks recent highs. Bullish indicators include a golden cross of EMAs and a rebounding RSI, despite MACD weakness. Development activity surge hints at potential upgrades, supporting further price gains.
Technical Levels:
- Support Levels: $0.04200 and $0.0680
- Resistance Levels: $0.1540 and $0.2560
Disclaimer
This article is for informational purposes only and does not provide any financial, investment, or other advice. The author or any people mentioned in this article are not responsible for any financial loss that may occur from investing in or trading. Please do your research before making any financial decisions.




