
 streamoors
 Sword Inu
 Altai the Tiger
 IGNITION
 no crying in the casino
 NEAR Protocol
 Pudgy Penguins
- The Volt Inu price is not trading with any fiat currencies.
- In the last one year, the price of crypto has declined by 56.8%.
Volt Inu operates as a deflationary token across Ethereum, Binance Smart Chain, and Polygon Chain. It stands out by aiming to be a central figure in crypto growth, employing burn and reflection mechanisms. VOLT is used in a DeFi ecosystem, offering decentralized exchange, NFTs, gaming, prepaid cards, and AI-integrated features.
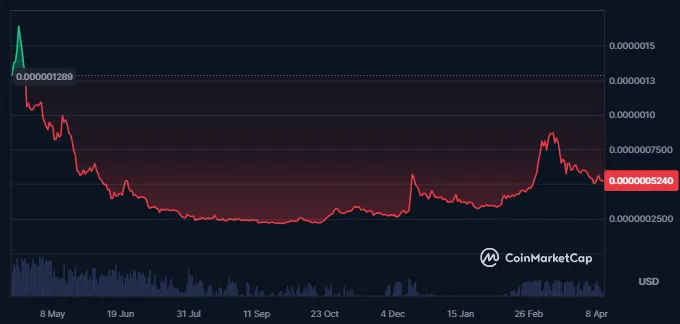
The circulating supply of the crypto is 54.766T VOLT and a total supply of 69.0T VOLT. The maximum supply of the crypto is also similar to the total supply of the crypto. The fully diluted market cap of the crypto is $36.14M, and the circulating supply of the crypto is $32.36M.
The volatility of the crypto is very low, which results in 0.00%, and certainly, the market cap dominance of the crypto is also very low. Also, the sentiment of the crypto is neutral, as per Coincodex, and the fear and greed index of the crypto indicates extreme greed.
The crypto market cap has further declined by 1.5% in the last 24 hours, and its traded volume has also witnessed a decline of 36.5%. That led to a volume/market cap ratio of 11.0%.
The value of the traded volume for the Volt Inu crypto is $2.998M, and its market cap is worth $28.683M. This further results in a market cap ranking of #807. Also, the price of the crypto has declined by 84% from its all-time high price of $0.000003513. The price was achieved on April 26, 2022.
VOLT Crypto Technical Analysis
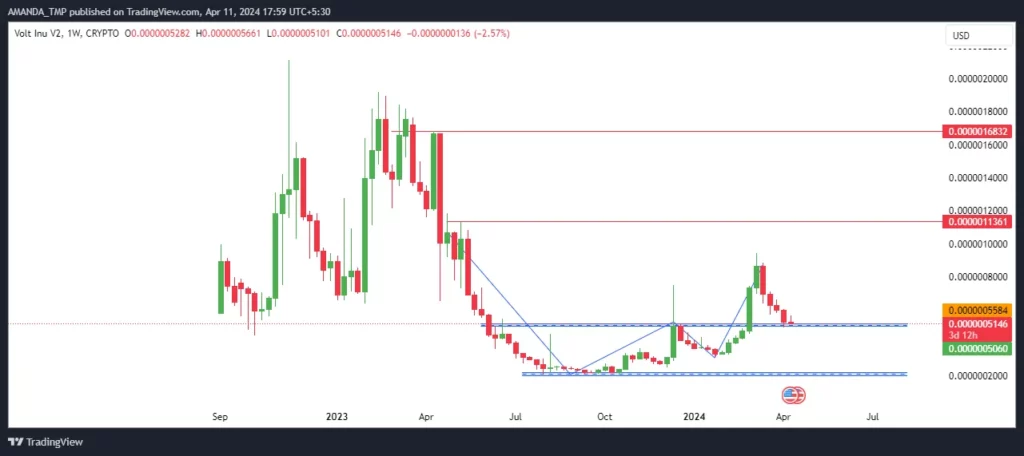
The VOLT crypto price is taking support at the crucial breakout levels and has formed strong bearish candlesticks on the chart. If the price of the crypto continues to decline, buyers might lose hope, and a further decline might be witnessed.
VOLT/USD Chart by TradingView
The price of the VOLT crypto has declined below the 20-day and the 50-day EMA by witnessing profit booking from the higher levels. The 50-day and the 200-day EMAs are trading in a golden cross, but if the price of the crypto declines below the 200-day EMA, the price might continue to slip to lower levels.
The MACD further is giving a strong signal as the MACD and the signal line has declined below the zero level and are trading in a bearish cross. The histograms further support the decline in price by forming bearish histograms.
The RSI is also showing weakness in the trading price of the VOLT crypto as it has declined to the level of 38.98. It trades below the 14-day SMA and has declined from the overbought zones.
Summary
Volt Inu’s price faces challenges as it struggles to sustain breakout levels, with strong bearish candlesticks indicating the potential for further decline. Despite low volatility and neutral sentiment, declining trading volume adds to the bearish outlook. Technical indicators signal weakness, with prices slipping below key EMAs and MACD, indicating a bearish trend.
Technical Levels:
- Support levels: $0.0000002250 and $0.0000003120
- Resistance levels: $0.0000011360 and $0.000001680
Disclaimer
This article is for informational purposes only and does not provide any financial, investment, or other advice. The author or any people mentioned in this article are not responsible for any financial loss that may occur from investing in or trading. Please do your research before making any financial decisions.




