
 streamoors
 Altai the Tiger
 Sword Inu
 IGNITION
 no crying in the casino
 Quantus
 NEAR Protocol
- Shiba Inu’s price prediction is bullish till it trades above key EMA levels.
- SHIB price is trading above the 50-day and 200-day EMAs, indicating a bullish trend.
- Shiba Inu crypto price is trading near the 50-EMA which is acting as a support level.
The Shiba Inu price prediction is optimistic as long as it trades above the 50 EMA level. However, the price requires buyers to bounce back and a short-term relief rally may trigger anytime from the lower levels.
Currently, SHIB price is trading below the 20-day moving average, which indicates weakness and profit booking in the cryptocurrency. However, in the previous week, the crypto price increased by almost 8%, suggesting a pullback rally.
In early March, the Shiba Inu price broke the $0.00004000 level. The boost in investor confidence was visible on the chart.
Previously, the sellers attempted multiple times to bring the price below the 50-day EMA, but the buyers prevented it from happening. This indicates that the buyers are still actively supporting the price.
Currently, the Shiba Inu price is trading in a narrow range of $0.00002822 to $0.00002010, and attempting to establish a short-term base. However, the trend appears to be mildly confusing, as the price isn’t showing any clear direction.
The SHIB price is currently trading at $0.00002471, with a decrease of 1.94% in intraday trading. The 24-hour volume to market cap ratio stands at 0.0371%.
Will Shiba Inu Price Break Above Or Break Below?
Shiba Inu price prediction is favoring the bears as of now as the price is facing weakness this month down by almost 17%. However, traders and investors may see a pullback rally in the upcoming sessions if the price breaks the $0.00003310 threshold.
If the SHIB crypto price remains below $0.00003310, it is expected to continue in a bearish trend. However, if buyers break out of this level, the price may skyrocket towards $0.00004500.
On the other hand, if the Shiba Inu price drops below $0.00002000, the correction could continue for some time. According to technical analysis, short sellers are currently active in Shiba Inu, but there is a possibility of a short squeeze in the future.
SHIB Retesting 50 EMA On Weekly Chart
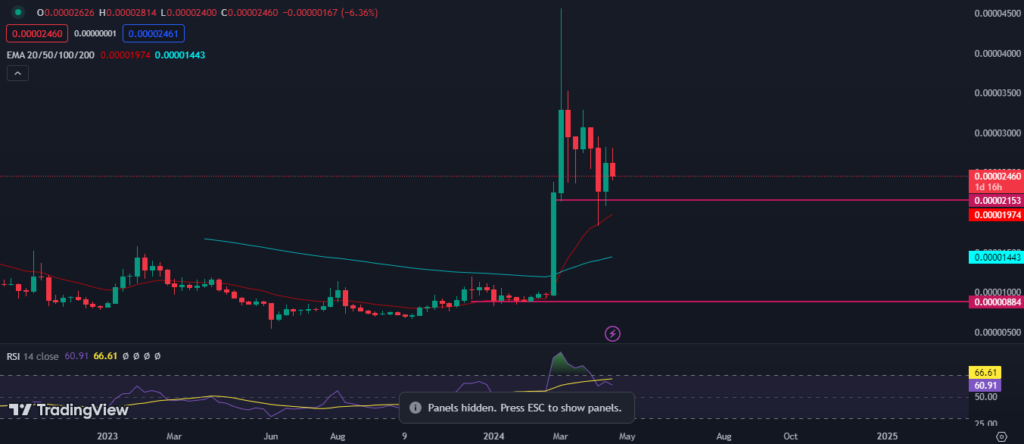
The SHIB price has recently retested the level previously broken out on the weekly time frame. This indicates that the price may bounce back and reach higher levels. The cryptocurrency leaders, BTC and ETH, are also experiencing a recovery, which could have a positive impact on the prices of Shiba Inu in the upcoming sessions.
The RSI is at 61 which denotes strength. It is near overbought territory demonstrating bullishness.
Shiba Inu Exchange Reserve Data vs Price Data
Over the last seven days, the exchange reserve has been on the rise, which could indicate an increase in selling pressure. Essentially, this means that a considerable number of users have deposited coins into the exchange, potentially signaling a heightened selling sentiment among traders. This could be viewed as a negative sign by the markets.
Conclusion
The Shiba Inu price prediction is bullish as long as it trades above key EMA levels, and a short-term relief rally may trigger anytime from the lower levels. The Shiba Inu price is trading near a support level which is acting as a base. If the price remains below $0.00003310, it is expected to continue in a bearish trend. However, if buyers manage to break out of this level, the price may skyrocket towards $0.e Shiba Inu price drops below $0.00002000, the correction could continue for some time. The SHIB price has recently retested the level that was previously broken out on the weekly time frame, implying that the price may bounce back and reach higher levels. The RSI at 61 indicating bullishness.
Technical levels
Resistance Levels: $0.00003000
Support Levels: $0.00002000
Disclaimer
This article is for informational purposes only and provides no financial, investment, or other advice. The author or any people mentioned in this article are not responsible for any financial loss that may occur from investing in or trading. Please do your research before making any financial decisions.




