
 Altai the Tiger
 Sword Inu
 streamoors
 IGNITION
 NEAR Protocol
 Pearl
Pearl Injective
- DOGE price has advanced by 121% in the last 1 year.
- The price volatility of the Dogecoin is medium.
Dogecoin was created in 2013 by Jackson Palmer and Billy Markus, started as a spoof on cryptocurrency hype.
Inspired by the Shiba Inu meme, DOGE uses Litecoin’s technology. It gained value through community use and celebrity endorsements, notably Elon Musk. DOGE is widely used for payments, including by Tesla.
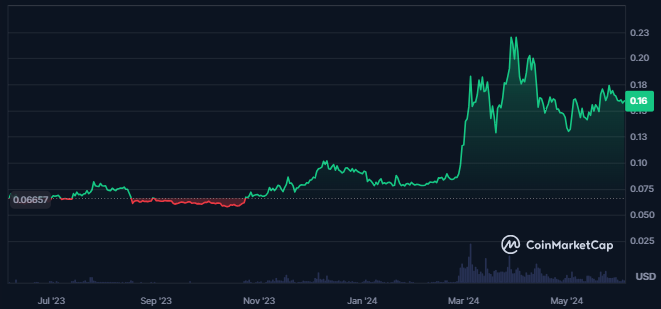
The trading volume and the market cap of the Dogecoin are at rest, witnessing a small decline over the last 24 hours. DOGE has a market cap dominance of 0.89%.
The price volatility of the crypto is also medium resulting in 4.95% which shows stability in the trading price of the crypto. The liquidity of the crypto is also high followed by a volume/market cap ratio of 3.54%.
DOGE Crypto Technical Analysis
Dogecoin‘s recent trading activity suggests a period of stabilization. Price has been confined to a specific range, highlighting a consolidation phase. A deeper look reveals bullish undercurrents.
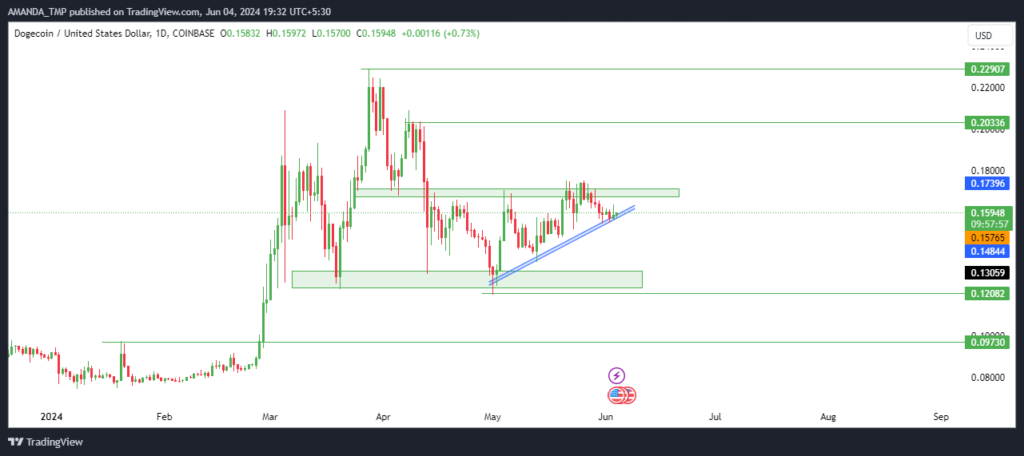
Technical indicators, specifically candlestick patterns, hint at the presence of buying pressure. Should DOGE decisively break above this consolidation zone and hold the new ground, it could be a significant development.
This kind of a breakout is likely to cause a momentum explosion that would attract a bunch of new buyers into the market; this additional buying power might push prices up even higher.
In such an instance, there are chances for continuous upward movements. Increasingly, as prices rise, there would probably be more positive sentiment towards bull markets which would also increase investor confidence in DOGE’s rise. This cycle could set the stage for substantial price gain.
DOGE/USD Chart by TradingView
Dogecoin appears to be going sideways as it hovers above the 50-day EMA at the time of writing. Besides this, it crossed the 200-day EMA to form a golden cross which is an indicator of bullish sentiment previously dominating the market.
The MACD parameters are trading in the positive territory signifying a bullish crossover. Nonetheless, histograms are receding indicating that momentum may soon change its direction.
Conversely, RSI is above 50 which means that there can be an increase in momentum. Notwithstanding this fact, it is beneath its SMA of 14 days’ period, suggesting that a bull run is likely.
Summary
During the past one year, Dogecoin has gone up significantly with moderate volatility.
This technical analysis shows likelihood of consolidation with a potential positive trend. Golden cross and MACD are also implying that but uncertainty is in the future price movement reflective of its intrinsic volatile crypto nature.
The support levels for the DOGE crypto are $0.0970 and $0.120 followed by the resistance levels of $0.2030 and $0.2290.
Disclaimer
This article is for informational purposes only and does not provide any financial, investment, or other advice. The author or any people mentioned in this article are not responsible for any financial loss that may occur from investing in or trading. Please do your research before making any financial decisions.




