
 Sword Inu
 no crying in the casino
 streamoors
 IGNITION
 Altai the Tiger
 Pearl
Pearl Quantus
- Chainlink price faced rejection from its resistance mark of $20 and reverted back.
- Buyers have lost their grip and unwinded their long positions.
- Sellers look confident and are eyeing to push the token toward the $10 mark.
The Chainlink (LINK) token price showcased a V shaped reversal from the $20 mark and retarced 30% this month, highlighting selling pressure on the chart. Additionally, it slipped below the key moving averages.
Recently, LINK reverted from its demand zone of $12 and lifted the gains toward the $20 mark, which is a primary resistance mark. Amidst the bullish momentum, buyers failed to stretch the pullback and felt there. Afterward, sellers entered the battle and pushed the token which spoiled the gains.
Although the Chainlink token has a strong support zone and a base around the $11 mark, which is a strong challenge for the sellers. Until LINK stays below it, buyers will remain in the game.
At press time, LINK was trading at $13.61 with an intraday drop of 5.32%, reflecting neutrality on the chart. It has a monthly return ratio of -16.30% and 144.20% yearly, reflecting short term weakness.
The pair of LINK/BTC is at 0.000212 BTC, and the market cap is $7.99 Billion. Analysts are neutral and suggest that LINK may retain strength and will pull back.
Could LINK Token Settle Gains Around the $12 Mark Amidst Selloff?
The Chainlink (LINK) token price is trading with bearish bias and fell to the downward trajectory support zone around $12-13, reflecting selling pressure in the last few trading sessions.
Following market indecisiveness, LINK lost the initial gains and retested the base at the $12 mark. Until LINK does not retain the $15 mark, the trend will remain negative and sellers are likely to dominate.
Source: Santiment
The Momentum Indicator (RSI) curve slipped to the oversold region and glimpsed a bearish divergence. Similarly, the MACD indicator displayed the red bars on the histogram and plotted a bearish crossover on the charts.
Its trading volume remained flat, while the market cap fell over 2%. Notably, LINK token has a total supply value of 1 billion and has a fully diluted market cap of $13.60 Billion.
Price Volatility and Weighted Sentiment Data Highlights Negative Outlook
Amidst the follow on decline, the price volatility remained average and displayed lower swings, justified the drop over 12% in the last 24 hours.
Source: Santiment
The weighthed sentiment data remained below the midline region and reflected declining investor. A tweet by @SpotOnChain highlighted that over 107.7 Million worth of LINK was transferred to Binance since Aug 2022.
21M $LINK ($295M) was unlocked from @chainlink Noncirculating supply contracts ~3hrs ago, including:
— Spot On Chain (@spotonchain) June 21, 2024
• 18.25M $LINK ($264M) to #Binance
• 2.25M $LINK ($31.3M) to Multisig 0xD50f
Notably:
– Chainlink has unlocked 127M $LINK and sent 107.7M $LINK to Binance at ~$9.89 since Aug… https://t.co/bVUDTMDFgZ pic.twitter.com/jxaO5Glxjb
Source: X
@CryptoTony in his post on X, revealed that above the $14.70 mark, the LINK token looks good to go for long ahead.
$LINK / $USD – Update
— Crypto Tony (@CryptoTony__) June 21, 2024
Reclaim $14.70 and we have a good entry, othewise hold off for the time being pic.twitter.com/5HaC9t90gR
Source: X
The immediate support levels for the LINK token are $13 and $2.30, whereas the key upside hurdle is around $15 followed by $15.80
Futures OI Data Overview
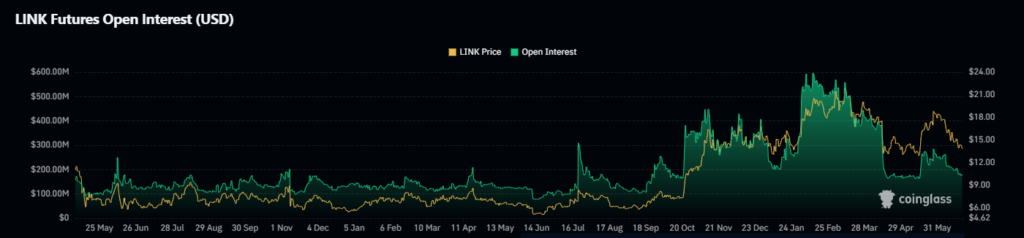
Following the price decline, the buyers unwinded their long positions this week.
Source: Coinglass
The open interest dropped over 3.25% to $178.61 Million in the last 24 hours, conveying the long unwinding activity.
Conclusion
The Chainlink token price dragged below the significant moving averages and is heading toward its prompt support zone of $11. Amidst the notable V shaped decline, the token is still looking good to go ahead.
Disclaimer
This article is for informational purposes only and provides no financial, investment, or other advice. The author or any people mentioned in this article are not responsible for any financial loss that may occur from investing in or trading. Please do your research before making any financial decisions.




