
 streamoors
 IGNITION
 Injective
 Aerodrome Finance
 ZKsync
 Collector Crypt
 Sui
Sui
- Jupiter token price has regressed to its crucial support zone of $0.7800 mark.
- Buyers have lost their momentum and are struggling to regain strength.
The Jupiter (JUP) token price struggled around the $0.7800 mark. It looks bearish on the chart.
For the past few trading sessions, the seller army continued to put pressure and the token revealed follow on decline. Additionally, the token was dragged below its key moving averages and directs underperformance on the charts.
Notably, a descending triangle pattern was formed and the token is at a make or break situation. If the token fails to hold the support level of $0.7750, it may slip toward the downside mark of $0.7500 followed by the $0.7300 mark.
Conversely, if the token rebounds from the demand zone, it may retest the $0.8800 followed by the $0.9300 mark ahead.
At press time, JUP traded at $0.7797 with an intraday drop of 2.306%, reflecting selling pressure on the chart. It has a monthly return ratio of -33.20% and 2500.30% yearly, reflecting short term bearishness.
The pair of JUP/BTC is at 0.0000308 BTC, and the market cap is $121.59 Million. Analysts are neutral and suggest that JUP may face volatile moves and will settle gains around the $0.7500 mark.
Jupiter (JUP) Might Rebound Gains: Here’s An Outlook
JUP is below the key moving averages and looks bearish. Moreover, the sellers continue to showcase their dominance and are eyeing to breach the prompt support zone of $0.7700 mark.
Source: Santiment
The trading volume declined by over 29.87% to $35.75 Million and the market cap fell over 1.29% in the past 24 hours.
Moreover, the technical indicators indicate underperformance, suggesting that further downtrend is imminent.
The Momentum Indicator (RSI) curve slipped to the oversold region and depicted a negative divergence on the chart. Likewise, the MACD indicator displayed red bars on the histogram and displayed a bearish outlook.
Price Volatility and Weighted Sentiment Data Outlook
The price volatility data signifies a decline of over 13% to 0.053, which implies that investors are in a dilemma and that sellers are dominating the battle.
Source: Santiment
The weighted sentiment data remained negative and the bear cartel looked confident and might push the token below $0.7700 shortly.
Social Metrics and Development Activity Data Insights
The Social Dominance data revealed flat movements and a decline in user engagement on social media platforms.
Source: Santiment
Moreover, the development activity data displayed a follow on decrease and fell to 12.74, implying a negative outlook.
Futures OI Data Reveal Long Unwinding Activity
The Futures open interest data delivers fear among its holders and the buyers have unwinded their long positions in the past weeks.
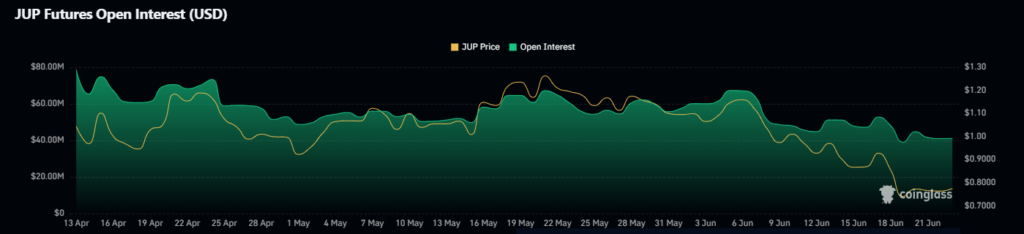
The open interest data dropped over 2.36% to $41.76 Million, revealing a long unwinding activity in the past 24 hours.
The immediate support levels for the Jupiter token are $0.7600 and $0.7500, whereas the key upside hurdle is around $0.8000, followed by $0.8200.
Conclusion
The Jupiter token price dragged below the 200-day EMA mark and is looking bearish on the charts. Moreover, the token dragged to its crucial support zone of $0.7700 and signified seller dominance.
Disclaimer
This article is for informational purposes only and provides no financial, investment, or other advice. The author or any people mentioned in this article are not responsible for any financial loss that may occur from investing in or trading. Please do your research before making any financial decisions.




