
 Sword Inu
 streamoors
 Altai the Tiger
 no crying in the casino
 IGNITION
 Pudgy Penguins
 Quantus
- The total value of the Stellar has advanced to $9.6M in the last few days.
- In the last 30 days, the XLM price has traded in green for 15 days.
Stellar has witnessed sellers’ dominance, followed by strong profit booking. The derivatives data supports the same, followed by huge long liquidation over time.
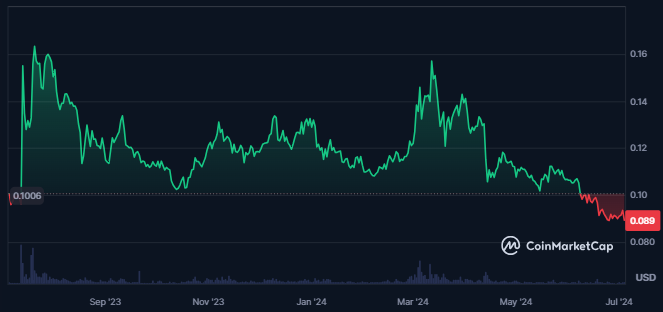
The stablecoin market cap is worth $204.56M, and the total amount raised by the crypto is $3.0M. The market cap of the Stellar further declined by 3.4% in the last 24 hours from press time.
At press time, the market cap value of Stellar crypto was $2.592 Billion. That makes it the 31st largest cryptocurrency in the global crypto market. The crypto’s volume/market cap ratio was 2.7%, followed by a traded value of $70.862M.
At press time, 58.33% of the maximum crypto supply was circulating, which is 29.167B XLM, and its maximum supply is 50.001B XLM.
Although the Stellar crypto price went up by 7100% from its all-time low price, it was down by 90.4% from its all-time high price at press time. The highest price ever achieved by XLM is $0.9381, achieved six years ago.
Stellar Crypto Derivatives Data Analysis
When writing, Stellar derivatives recorded huge, long liquidation in the last 24 hours. It showed the buyers were losing in the derivatives of the crypto.
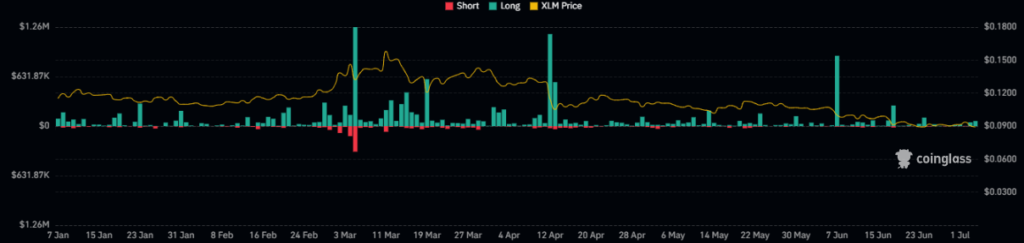
The Stellar crypto’s liquidation chart showed consistent profit booking in longs over the last few months. It indicated the sellers have been ruling over the price for a long time.
The open interest in crypto remained static over the last few days, and no significant change has occurred. It also shows investors and traders were not very active and might be waiting for the right opportunity.
XLM Crypto Technical Analysis
For a long time, the price of crypto has declined from higher levels, forming a lower-low swing on the daily chart. Also, the price traded inside a falling wedge pattern at press time.
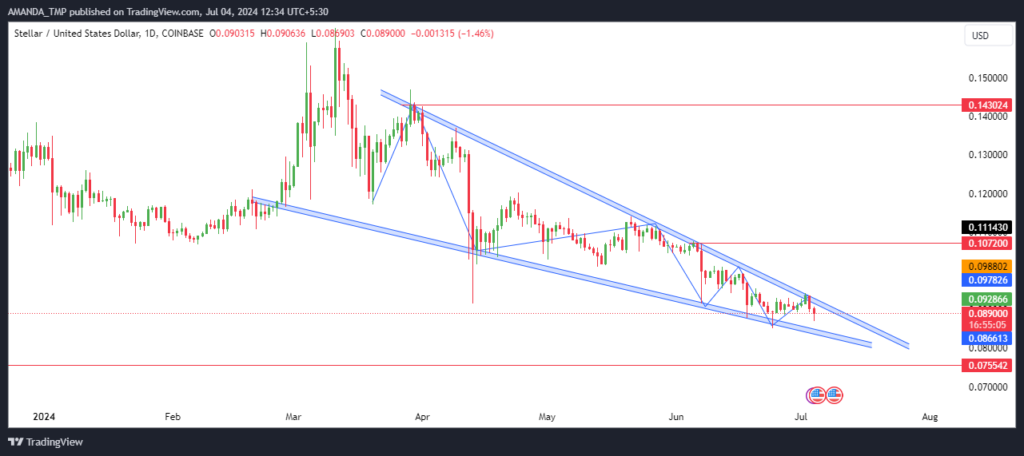
In mid-June 2023, the XLM crypto price witnessed a strong surge of 150% in just one month. The crypto price paused and consolidated for a long time.
Additionally, from the beginning of March 2024, XLM crypto price started to witness profit booking. It led to a decline of 45% in trading price in approximately four months.
If the price succeeds in breaking above the descending triangle pattern and sustained, we might see the price achieving higher levels.
XLM/USD Chart by TradingView
The EMAs on the XLM crypto daily chart were trading in a death crossover. The price declined below the 50-day and the 200-day EMAs and has traded below the same for a long time.
The MACD and the signal line sustained in the negative territory, while the metrics formed a golden crossover. When writing, the histograms were losing strength. It hinted at the possibility of a future change in the price trend.
The RSI followed a bearish cycle followed by sustainability below the 50 level for a long time. At press time, the RSI was at 36.69, which showed a weakness in the momentum of the crypto.
Concluding Thoughts
Stellar’s (XLM) price has been trading within a descending triangle pattern, and mixed signals have been seen.
Despite a recent 150% surge, it’s down 90.4% from its all-time high. Indicators showed bearish trends and significant long liquidations, suggesting uncertainty. A breakout above the pattern could change the trend.
When writing, the XLM crypto support levels were $0.0650 and $0.0750, followed by the resistance levels of $0.1070 and $0.1430.
Disclaimer
This article is for informational purposes only and does not provide any financial, investment, or other advice. The author or any people mentioned in this article are not responsible for any financial loss that may occur from investing in or trading. Please do your research before making any financial decisions.




