
 astronaut
 Pearl
Pearl Zcash
Zcash Walrus
 NEAR Protocol
 Starknet
 Pudgy Penguins
- The market cap of the Celestia (TIA) token has advanced by 14% in the last 24 hours.
- TIA token has high liquidity based on its market cap.
TIA has witnessed huge engagements over the last 24 hours which has resulted in a traded value of $129.738 Million. This was followed by a 54% surge in the trading volume of the token.
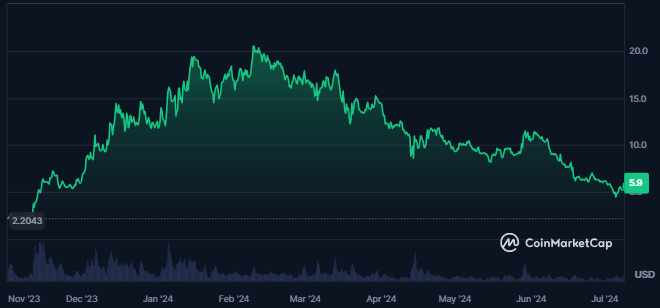
The fully diluted market cap of the token is $6.281 Billion following which the market cap of the token was $1.165 Billion. Also, the volume/market cap ratio of token is 11.10% reflecting high liquidity.
While the Total Value Locked (TVL) of the token is nil, it has recorded inflows of $2.97 Million and raised a total of $1.5 Million.
The fear and greed for the token further is at 28 which denotes fear among the investors. The sentiment of the token further is bullish while the price volatility of the token is high resulting in 18.34%.
Celestia Token Derivatives Analysis
The derivatives data of TIA shows a surge of 56% in the trading volume of the token. This further resulted in a traded value of $408.10 Million of derivative contracts.
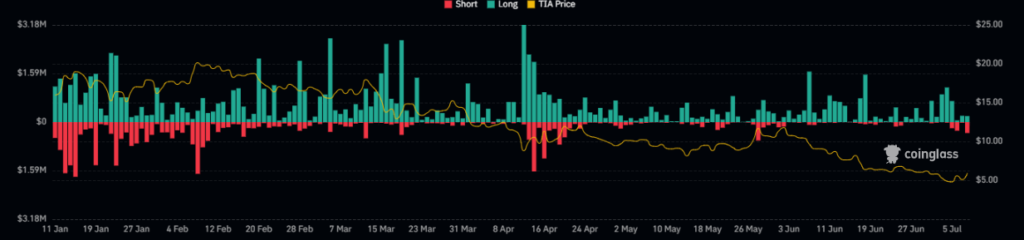
The open interest of the token has also advanced by 29% which further results in $106.73 Million. The recorded long liquidation of the token is lower than the shorts liquidated in the token in the last 24 hours from the press time. The following behavior of the data shows bulls dominance over the price.
TIA Token Technical Analysis
The technical chart of TIA reveals a falling wedge pattern, characterized by lower low swings followed by lower highs. This pattern indicates a consistent decline in the price of the token, highlighting a bearish trend over time.
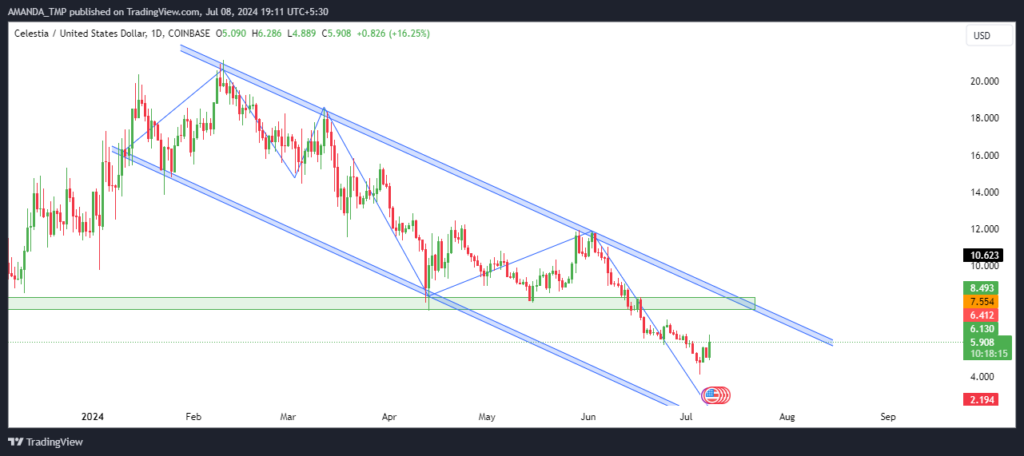
Over the last five months, TIA experienced significant profit booking. This period has been marked by a series of bearish candlesticks on the daily chart, signaling a strong likelihood of continued price decline. The persistent downward pressure has contributed to the overall bearish sentiment surrounding TIA.
TIA/USD Chart by TradingView
TIA token has declined below the 20, 50, and 200-day EMAs, with these moving averages forming a death cross. This bearish formation indicates a consistent downtrend, as the token’s price steadily decreased alongside the declining EMA values.
The MACD and signal line have overlapped, both trading in negative territory. This overlap reflects underlying weakness and heightened volatility in TIA’s price action.
Additionally, the RSI has persistently remained below the 30 level, indicating strong bearish momentum. The RSI further declined below the 14-day SMA on the daily chart, reinforcing the negative sentiment surrounding TIA token.
Celestia (TIA) token’s market cap surged 14%, with high liquidity and increased trading volume. Despite the bullish sentiment, technical analysis shows bearish trends, with the price consistently declining below key EMAs and indicators signaling weakness.
The dominance of short liquidations suggests a potential for buyer takeover, but uncertainty remains high. The support levels for the TIA token are $1.500 and $2.10. Additionally, the token price might find resistance at the $8.20 and $11.90 levels.
Disclaimer
This article is for informational purposes only and does not provide any financial, investment, or other advice. The author or any people mentioned in this article are not responsible for any financial loss that may occur from investing in or trading. Please do your research before making any financial decisions.




