
 streamoors
 IGNITION
 Injective
 Quantus
 NEAR Protocol
 Pearl
Pearl LayerZero
- LDO is revolving around the same level for the last 1 year.
- As per Coincodex, the sentiment of the Lido DAO token is bearish.
A surge in the number of holders of the token was recorded over the last few days. Additionally, 53.37% of the supply is held by the top 10 holders of the crypto.
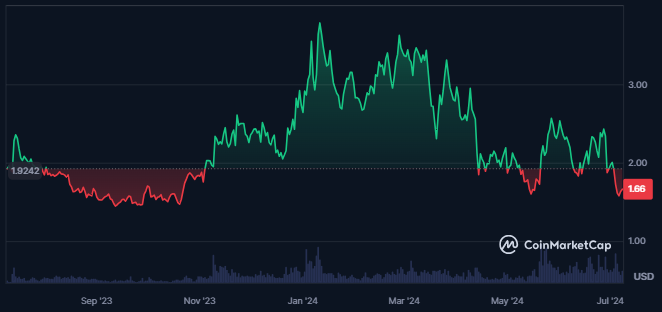
The market cap of the Lido DAO token has advanced by 5.3% in the last 24 hours resulting in a market cap of $1.487 Billion making it the 53rd largest crypto in global crypto market.
The market cap dominance of the token is 0.07% which reflecting strong market presence. The supply inflation of the crypto is also very low at (1.45%).
The volume/market cap ratio of the Lido DAO token is 8.53% reflecting good liquidity. This makes it easier to buy and sell the crypto in different market conditions.
Blockchain Data Overview of Lido DAO Token
The token incentives have surged in the last 30 days. This shows that more tokens are distributed among the users as incentives.
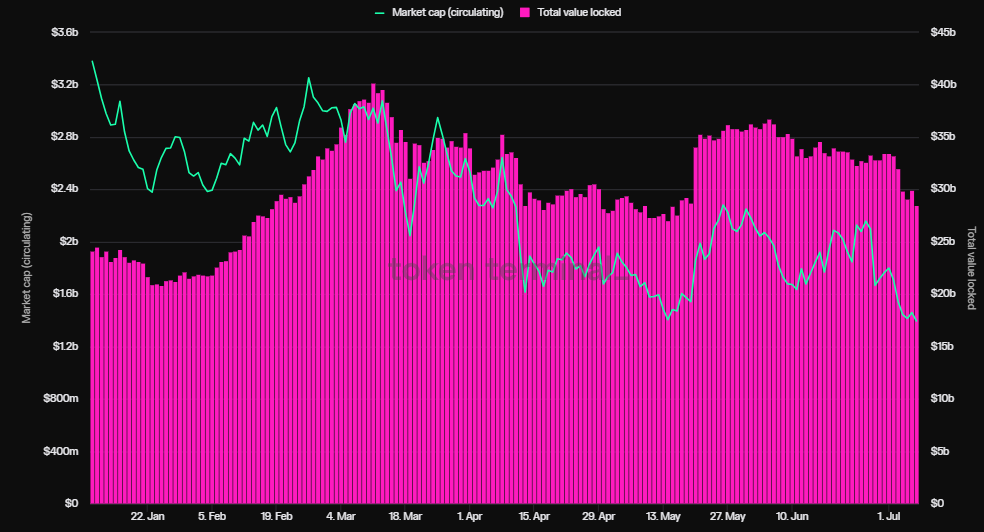
The circulating market cap of the token has been declining over time while the TVL has been stable. This shows that despite the decline in crypto price, users have confidence in its project.
Technical Analysis
The support level for LDO has been at a demand zone for the last 1 year.
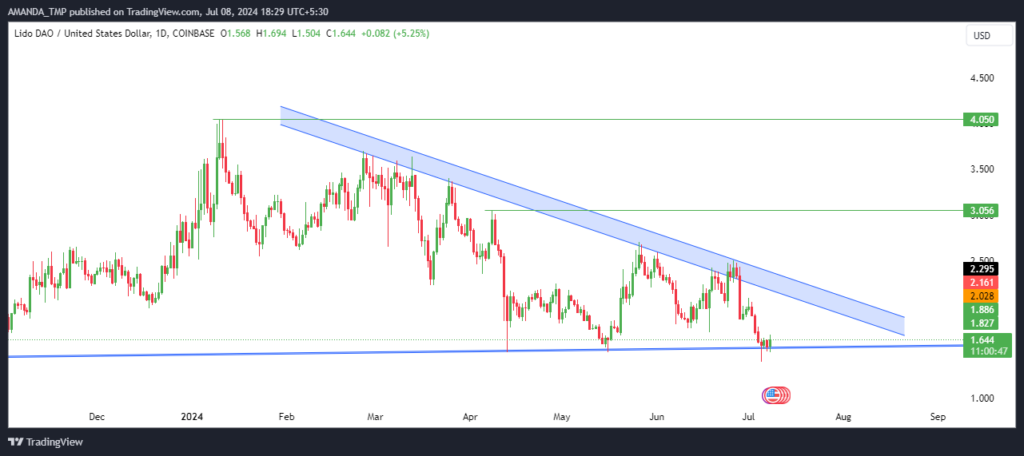
LDO crypto has been consistently declining from the higher levels for a long time from the swing high of $4.050. The following decline in the price further led to the formation of a descending triangle pattern.
Additionally, the price of the crypto found support at crucial lows at press time which also is a very strong demand zone. If the price witnesses buying and breaks above the descending triangle pattern and sustains above the same, a bullish trend in the crypto could be seen.
LDO/USD Chart by TradingView
LDO is trading below the 50-day and the 200-day EMA followed by a strong downtrend. The supertrend on the chart further gave a sell signal which shows high probability of further decline in the price.
The MACD is also negative on the charts as the MACD and the signal line are trading in a death cross below the zero level. The RSI also follows a bearish cycle followed by the RSI trading below the 14-day SMA. It further has sustained below the 50-level for a long time.
Summary
LDO shows bearish sentiments with technical indicators pointing to potential further decline.
Despite strong demand support, the price needs to break above the descending triangle pattern for a bullish trend. Current trading below key EMAs and negative MACD and RSI signals suggest continued uncertainty. The support levels for LDO are $1.0 and $1.20, followed by the resistance levels at $3.0 and $4.0.
Disclaimer
This article is for informational purposes only and does not provide any financial, investment, or other advice. The author or any people mentioned in this article are not responsible for any financial loss that may occur from investing in or trading. Please do your research before making any financial decisions.




