
 Altai the Tiger
 IGNITION
 streamoors
 Sword Inu
 NEAR Protocol
 Injective
 Quantus
- Huge long liquidation has been recorded in the Shiba Inu token in the last 24 hours.
- SHIB token price has advanced by 120% in the last 1 year.
The top 10 holders of the Shiba Inu token have 71.58% of the total supply. It has a total of 1.356 Million holding addresses. The largest holder of the taken alone holds 301.115 Trillion SHIB, which is 30% of the supply.
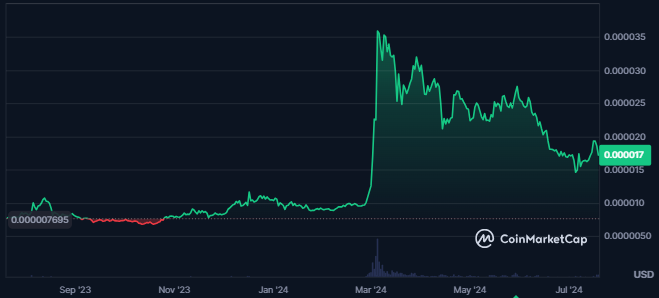
Price Overview Chart of SHIB | Source: CoinMarketCap
Shiba Inu token has high liquidity as 13% of its market cap was traded in the last 24 hours, resulting in a value of $1.174 Billion. The traded volume ranking of the token is #9, as per CoinMarketCap.
Shiba Inu is among the most popular meme coins and the 13th largest cryptocurrency in the global crypto market. It has a market cap of $10.127 Billion, which results in market cap dominance of 0.43%.
Shiba Inu token has a strong security score of 92.47, ranking #27 in the global crypto market. It also belongs to the AA tier, which shows the reliability of the token protocol. The following data is certified by Certik Skynet.
Financial Data Overview of Shiba Inu
Out of the total holders of the token, 51.89% of them are in profit (697.67K addresses).
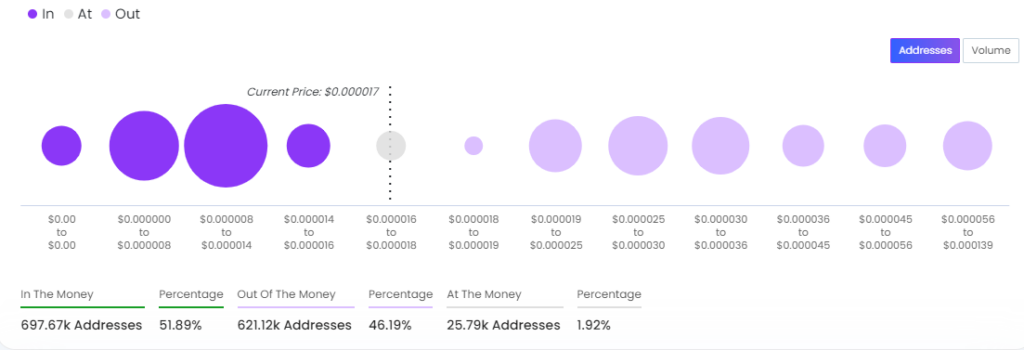
Global In/Out Of the Money of Shiba Inu | Source: Ixfi.com
The whale concentration of the token is high, resulting in 73% and 77% of the token holders holding it for more than one year.
At press time, 621.12K of the holders are is loss, which means they are incurring losses. Also, 1.92% of the token holders are the ones who are at breakeven.
SHIB Token Technical Analysis
SHIB token has declined below a strong support zone, exhibiting bearish character.
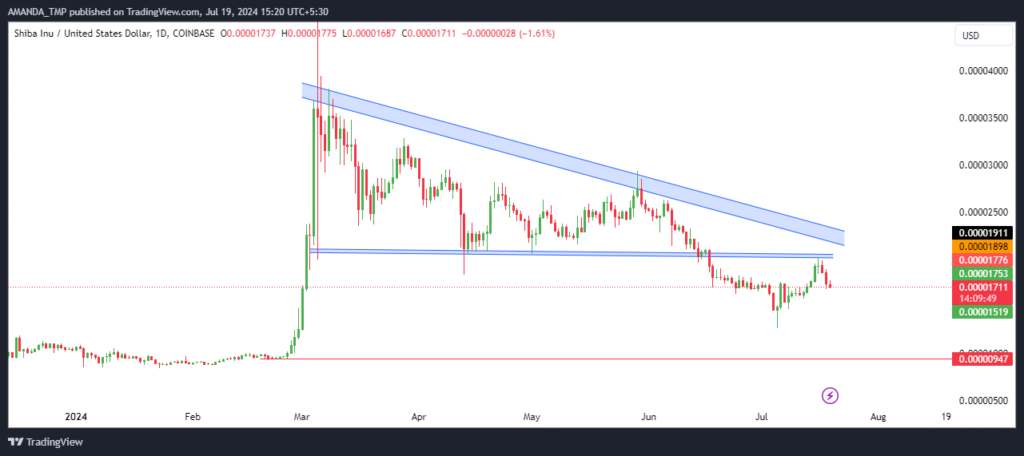
SHIB Token Daily Price Chart | Source: TradingView
SHIB price took support at a lower level, followed by the formation of lower highs on the chart. The token price entered a descending triangle pattern on the chart.
The SHIB token price further broke down below the following pattern, showing bears’ dominance in the price indicating a higher possibility of further decline in the token price.
SHIB/USD by TradingView
The 50-day and 200-day EMAs on the daily chart of the SHIB token have overlapped, showing uncertainty in the token price. Despite this, the token declined below the following EMAs, showing weakness in the trend.
The MACD and the signal line traded in a bearish trajectory, while the histograms formed on the chart are bullish uncertainty.
The RSI further broke above the 50 level but failed to sustain the higher levels, declining to the 46 level. This shows a lack of momentum for the price.
SHIB Token Falls Below Crucial Support Levels
SHIB has fallen below crucial support levels, indicating bearish momentum. With a high whale concentration and significant long liquidations, the token exhibited weakness.
Technical indicators, including a descending triangle pattern and declining RSI, suggest a potential for further price decline.
If SHIB continues to decline to lower levels, it might take support at $0.00000940 and $0.00001270. This is followed by the resistance levels of $0.0000280 and $0.00003810.
Disclaimer
This article is for informational purposes only and does not provide any financial, investment, or other advice. The author or any people mentioned in this article are not responsible for any financial loss that may occur from investing in or trading. Please do your research before making any financial decisions.




