
 streamoors
 IGNITION
 Sui
Sui Quantus
 Bitcoin
 Pearl
Pearl Solana
- The Michi token price is not traded on any trusted exchange as of now.
- The token has surged over the last few days.
According to analysts, MICHI’s sentiment has been bullish, reflected by the fear and greed index reading of 69, indicating greed.
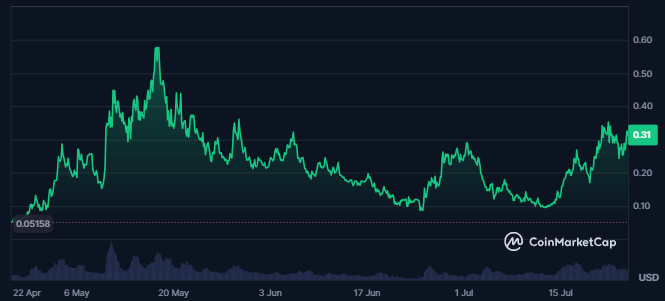
Price Overview Chart of MICHI | Source: CoinMarketCap
Traded volume declined by 5.45% to $25.330 Million intraday, followed by a volume/market cap ratio of 14.70%. MICHI’s market cap further advanced by 15.9% to $174.258 Million in the last 24 hours from the press time. The token ranked #264.
Additionally, the token’s total and circulating supply have been the same (555.770 Million MICHI). This was followed by a fully diluted market cap of $175.379 Million, the token’s market cap dominance was 0.01%.
The volatility stands at 34.51% reflecting a high probability of uncertain spikes in the token’s price. Moreover, the token’s market cap presence was certainly low, as the market cap dominance of the token has been 0.01%.
The Michi token’s price hit an all-time high price of $0.5957 two months ago from the time of writing. At press time, the token’s price is down by 47% from its all-time high price.
About three months ago, MICHI token price hit an all-time low of $0.04543, and since then, the token price has advanced by 580%.
MICHI Token Technical Analysis
MICHI followed a strong uptrend, steadily advancing to higher levels in the last few days.
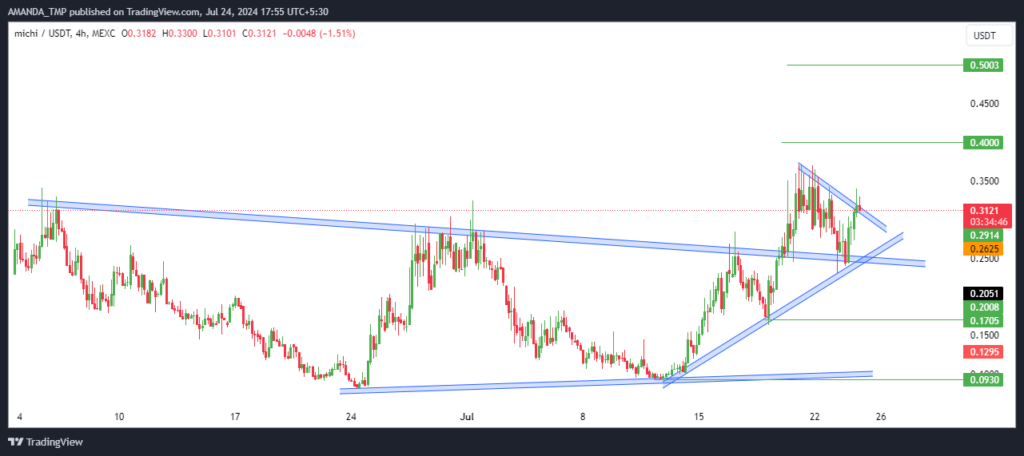
MICHI Token Daily Price Chart | Source: TradingView
MICHI token price followed an uncertain price action followed by a volatile momentum in the token’s price. The following behavior of the token price led to the formation of a falling wedge pattern.
The token’s price broke out above this falling wedge pattern and sustained above the same. Additionally, after the breakout, the price got rejected from a higher level, forming a dynamic resistance trendline.
MICHI/USDT Chart by TradingView
The 20,50 and 200-day EMAs are trading in a golden cross as MICHI advanced above the EMAs. The MACD and the signal line overlapped, as the indicators’ metrics sustained in bullish trajectory.
RSI has further taken support at the 50-level and crossed above the 14-day SMA, which exhibits bullish behavior in the token price.
The MICHI token shows strong bullish momentum, advancing 580% from its all-time low and forming a falling wedge pattern on the technical chart.
Despite recent volatility and a 47% drop from its all-time high, the EMAs, MACD, and RSI indciated bullishness, suggesting potential for further gains. The support levels for MICHI token are $0.090 and $0.1700, followed by resistance from $0.400 and $0.500.
Disclaimer
This article is for informational purposes only and does not provide any financial, investment, or other advice. The author or any people mentioned in this article are not responsible for any financial loss that may occur from investing in or trading. Please do your research before making any financial decisions.




