
 streamoors
 Altai the Tiger
 Sword Inu
 IGNITION
 no crying in the casino
 Quantus
 NEAR Protocol
- The SATS token’s circulating supply has not been disclosed.
- Higher short liquidations have been recorded in the 1000SATS token price.
The token’s circulating supply has been 2.1T SATS, similar to the total supply. This was followed by a fully diluted market cap of $695.631M, resulting in a similar market cap value.
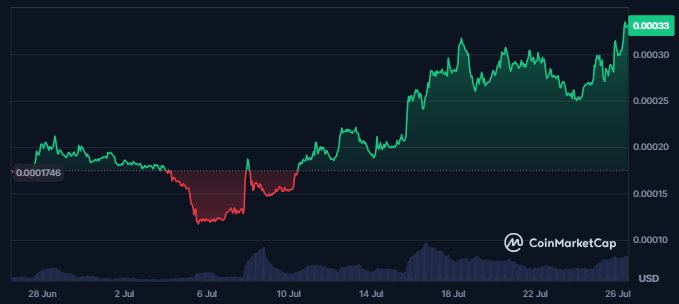
The SATS token’s price has advanced by 190% from its all-time low price of $0.0001129, formed just 21 days ago from the press time. The token’s all-time low was also formed on July 05, 2024.
Moreover, the all-time high of $0.0009348 was formed on December 26, 2023, and the token’s price has declined by 64% since then.
The 1000SATS token’s market cap has advanced by 17% in the last 24 hours. This resulted in a market cap value of $693.344M, making it one of the top 100 crypto assets in the global crypto market.
The token’s traded volume value has also advanced by 17% over the last 24 hours. Additionally, the token’s traded volume has been $202.263M, resulting in a volume/market cap ratio of 29.19%.
Following the token’s volume/market cap ratio, we can see that the token’s liquidity is excellent. This makes it easier for investors to buy and sell the token, which could be the reason for the increase in their confidence in the token.
1000SATS Token Derivatives Data Analysis
The token’s derivatives traded volume has also advanced by 40% over the last 24 hours. This resulted in a traded value of $917.72M, which indicated a rise in the demand for the 1000SATS token.
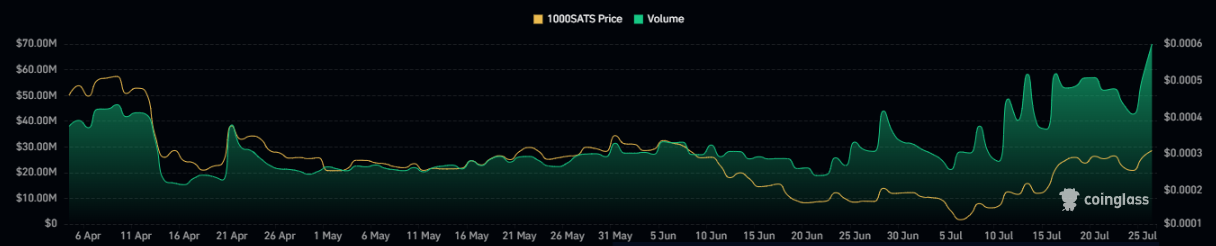
The token’s derivatives volume chart showed a huge surge over the last few days. Following this, a surge of 44% in the token’s open interest was recorded. This showed an increase in the number of open positions for the token.
The token’s liquidation data further showed a huge short liquidation of $900.41K, against which the recorded token’s long liquidation was $436.25K. This showed buyers’ dominance in the token price.
SATS Token Technical Token Analysis
The 1000SATS token’s recent price action indicated bullish behavior as the price has broken out above the most recent swing low.
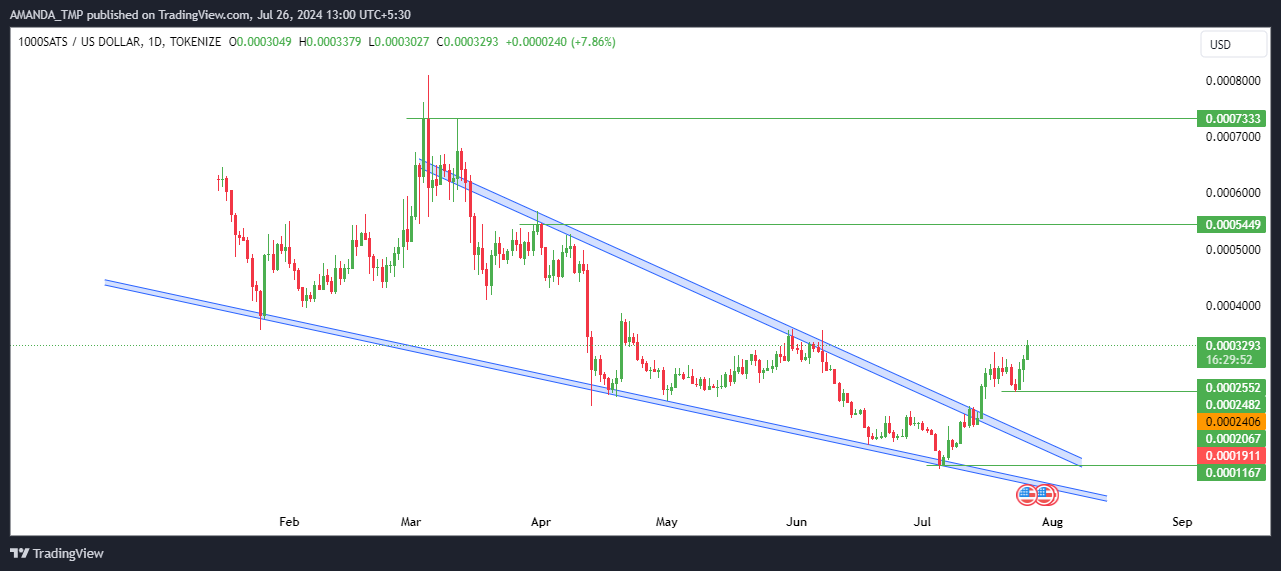
From the swing high of $0.0008095, the token’s price started to decline from the higher levels. The formation of a lower low swing on the chart followed this.
The following behavior of the token led to the formation of a dynamic falling wedge pattern on the chart.
At press time, the token’s price broke out above the pattern with strong momentum and has advanced by 45% since then.
SATS/USD Chart by TradingView.com
The supertrend gave a bullish signal on the chart, following which the 20-day and the 50-day EMAs traded in a golden cross.
The MACD metrics also advanced above zero and traded in a bullish trajectory. The RSI also gave a closing above the 14-day SMA on the chart, which has sustained above the 50-level.
Bulls dominating the price
Bulls are slowly dominating the SATS token price, with the token seeing a 190% increase from its all-time low 21 days ago.
Market and trading volumes have surged, indicating strong investor confidence. Technical indicators show bullish momentum, with key metrics such as the MACD and RSI supporting further upward movement.
Following the bullish momentum, the SATS token’s price might face resistance at the level of $0.000540 and $0.000730. Also, the support levels for the token are $0.00110 and $0.000250.
Disclaimer
This article is for informational purposes only and does not provide any financial, investment, or other advice. The author or any people mentioned in this article are not responsible for any financial loss that may occur from investing in or trading. Please do your research before making any financial decisions.




