
 streamoors
 IGNITION
 Injective
 Pearl
Pearl NEAR Protocol
 Quantus
 Aerodrome Finance
- BRETT price noted a negative intraday change of over 6% to $0.1230.
- Its Open Interest dropped over 8.46%, signifying long unwinding activity.
Brett (BRETT), a memecoin developed on Base, the Coinbase layer-2 stayed inside a falling channel and continued to retrace gains.
At press time, BRETT crypto changed hands at $0.1230 with a negative change of over 6%. The market cap fell to $1.23 Billion, and the pair of BRETT/BTC was at 0.00000183.
This week, the BRETT price attempted to cross the descending trendline hurdle of $0.1350. However, it faced rejection and dropped below the 50-day EMA mark, conveying the seller’s dominance.
The BRETT price is stuck between two places; it has been restricted between two endpoints. On the upside, it faced a downward trendline hurdle near $0.1350.
On the downside, it is continuously trying to sustain gains near the upward trendline support zone of $0.1100.
This makes the memecoin engaged inside a closed range. It continues to form lower and low swings and stays in the channel’s trajectory.
Until the memecoin has not crossed the aforementioned limits, it could continue to consolidate in a range. Once it escapes the channel’s trajectory, a significant upswing or downswing can be seen ahead.
BRETT Lost Strength: Is Further Selloff Possible?
The price action showed that the BRETT price was trading on a retracement track. It might retest its 100-day EMA mark.
Based on the ongoing trend, the next correction wave was imminent. The memecoin may drag toward its pivotal support of $0.1000 soon.
For the past weeks, BRETT has attempted to cross the cluster of $0.1400 multiple times but has faced rejection. The recent structure is a sell-on high, and the memecoin failed to sustain above the 20-day EMA mark.
BRETT Price Chart | Source: Santiment
The Relative Strength Index (RSI) indicated that the memecoin drove a bearish move. The RSI curve slipped below the midline region, signifying weak momentum.
Likewise, the Moving Average Convergence Divergence (MACD) indicator guided a bearish stance. It dragged below the signal line underlying the selling pressure.
Per the Fib retracement levels, the memecoin has an immediate 23.6% support zone near $0.1100.
Weighted Sentiment and Social Dominance Data Outlook
The weighted sentiment data hovered close to the midline region, noted at -0.538, pointing to mixed investor cues.
Notably, the negative reading guided a bearish stance. The holders were not confident enough to lift the price upwards.
Social Dominance Data | Source: Santiment
The Social Dominance data displayed flattish movements and stayed below the midline region. It directed no significant investor activity or chatter on social media platforms.
@MacroCRG, in his tweet on X, said that BRETT has made multiple bottoms around the downside of $0.1000. It is eyeing to breach the descending trendline hurdle ahead.
$BRETT looks ready for another leg of price discovery pic.twitter.com/frK4CDsNoM
— CRG (@MacroCRG) July 26, 2024
A Tweet by @MacroCRG | Source: X
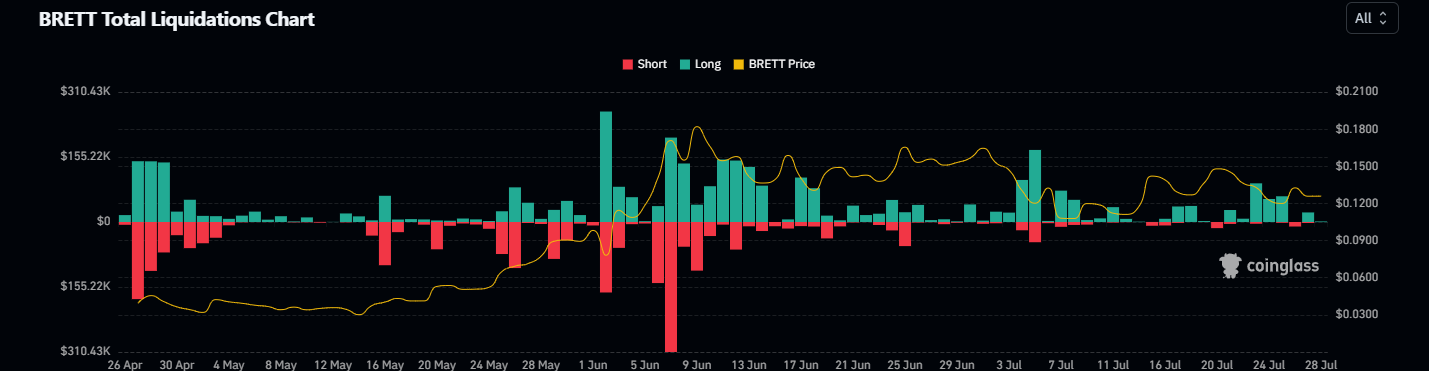
Long Liquidations Revealed a Rise
At press time, the short liquidations were at $1.20k, whereas the long liquidations were at $20k. This signified that bulls looked cautious and panicked, while sellers continued to outpace the bulls and tried to maintain their upper hand.
If the memecoin continues the downmove, it may retest its immediate support zone around $0.1250, followed by $0.1100.
In contrast, If the BRETT price crosses the resistance mark of $0.1350, it may be difficult to cross the upside of $0.1450, followed by $0.1500 ahead.
The BRETT token price dragged below the 20-day and 50-day EMA mark and looks slightly bearish on the chart. Its structure favored the downside, and bears persisted in adding short positions while the bulls stayed on the back foot.
Disclaimer
This article is for informational purposes only and provides no financial, investment, or other advice. The author or any people mentioned in this article are not responsible for any financial loss that may occur from investing in or trading. Please do your research before making any financial decisions.




