
 IGNITION
 streamoors
 Injective
 NEAR Protocol
 Pearl
Pearl LayerZero
 Quantus
- INJ token outperformed 74% of the top 100 crypto assets in the last year.
- Injective tokens traded in green for 13 days in the last 30 days.
The supply inflation of the token was high, resulting in 11.52%, which makes it possible to have uncertain spikes in the price.
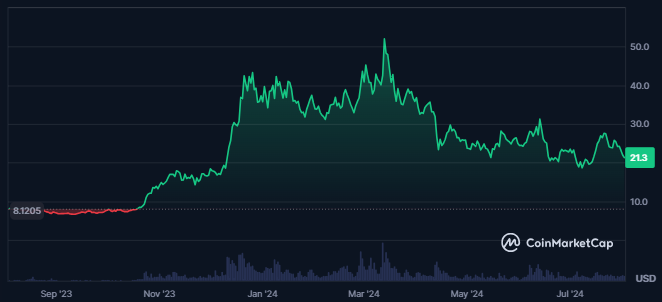
Injective Protocol had 43.9K holders at press time, and the number of token holders consistently advanced over time. This showed a gain of confidence among the investors in the token’s future performance.
Injective tokens had a strong market presence followed by a market cap dominance of 0.09%. It also was the 43rd largest cryptocurrency in the global crypto market and has a market cap of $2.071B.
A slight decline of 0.81% was recorded in the value of the token’s traded volume, resulting in $111.561M, which was 5.67% of the token’s market cap. This shows good liquidity in the token, making it easier to buy and sell it in different market conditions.
About four years ago, an all-time low of $0.6557 was made, and since then, the token price advanced by 3100%, and the price traded at a level of $21.33 at press time. Also, the all-time high price of $52.75 was achieved just five months ago. Since then, the injective token price has declined by 59%.
Blockchain Data Overview Of Injective Token
The total value locked for the injective token was worth $34.33M at press time, but it has declined over the last few days.
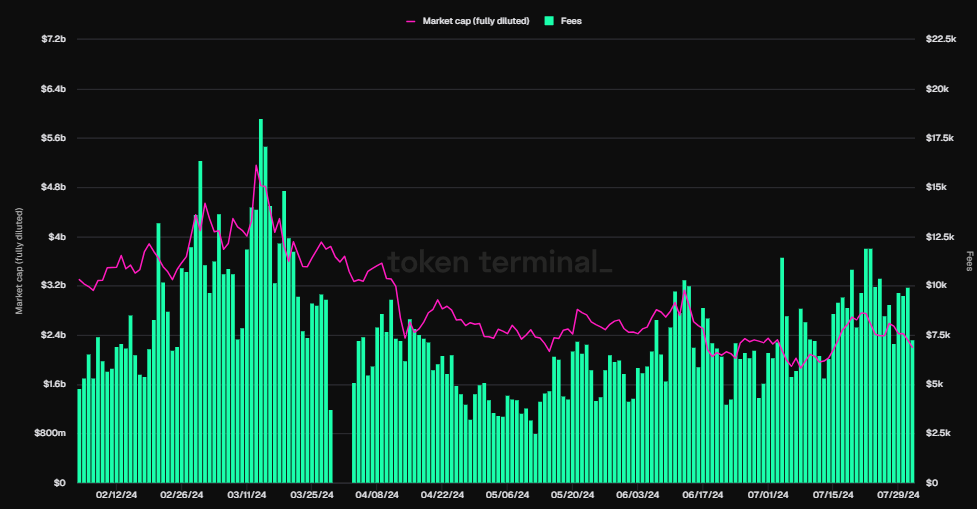
A surge in the Injective token’s fees was recorded over time, showing a surge in the engagement of token users. Despite this, the fully diluted market cap of the token was static over the last few days.
INJ Token Technical Analysis
The INJ token price traded inside a falling wedge pattern followed by the formation of lower low swings on the chart. The token price witnessed a consistent decline and profit booking over the last five months.
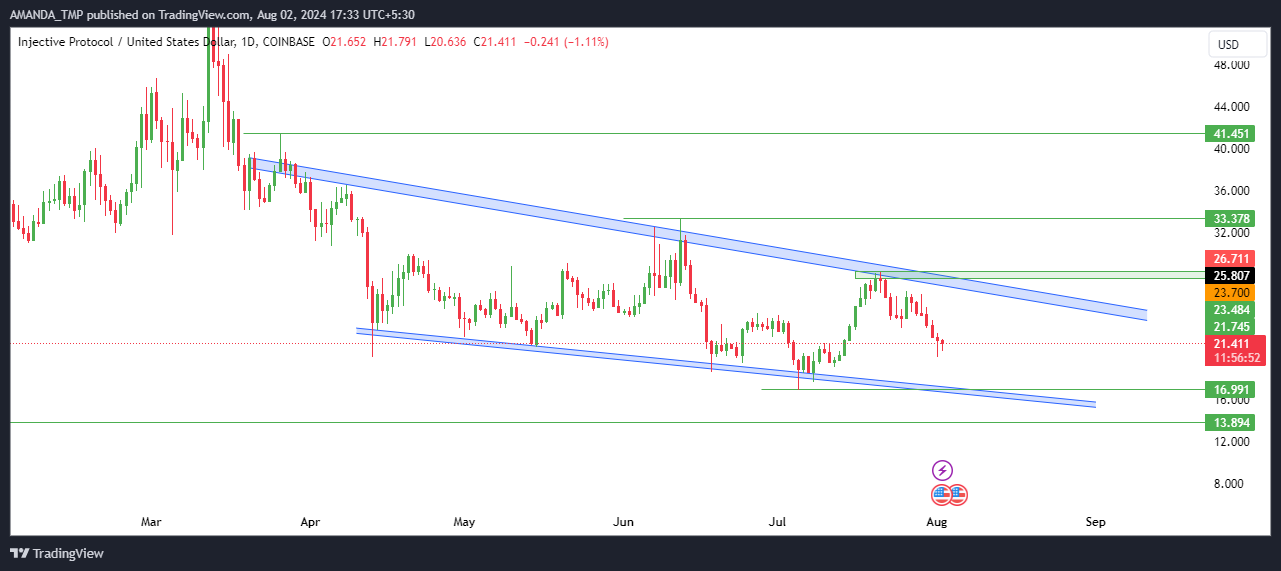
This showed a negative sentiment among the traders for the token. If the price breaks above the falling wedge pattern and sustains above the same, a bullish momentum in the token price might be seen.
Injective Token Technical Indicators Overview
The 50-day and the 200-day EMAs traded in a death cross, and the tokens’ prices also traded below the same. The following behavior of the EMAs exhibited a pre-existing downtrend in the token’s price.
INJ/USD Chart by TradingView.com
The MACD and the signal line traded in a death cross while the metrics advanced to the bullish trajectory. Despite this, the histograms formed on the chart were bearish.
The RSI had declined below the 50-level and 14-day SMA. This showed a decline in the momentum of the token.
The support levels for the INJ token are $13.80 and $16.90, followed by the resistance levels of $28.20 and $33.30.
Disclaimer
This article is for informational purposes only and provides no financial, investment, or other advice. The author or any people mentioned in this article are not responsible for any financial loss that may occur from investing in or trading. Please do your research before making any financial decisions.




