
 Sword Inu
 no crying in the casino
 streamoors
 IGNITION
 Altai the Tiger
 Pearl
Pearl Quantus
- WBT price surged by 14% in the past 40 days and reached a new ATH.
- The resistance level of $10 has flipped to the support level and is rising steadily.
From the beginning, the WBT witnessed a sharp one-sided move and surpassed the $10 mark. After every pullback, the buyers have lifted the price to a new all-time high.
At the beginning of July, the RSI developed a bullish divergence which was followed by strong buying pressure. WhiteBIT Coin price managed to defend the 20-day EMA for a longer period and has worked as a floating support level.
In May, the buyers had failed to exceed the $10 hurdle and the sellers won the battle, which resulted in bearish momentum. In the first week of July, buyers attempted to surpass this zone but couldn’t do so. However, in mid-July, the price broke out from this zone, witnessed strong buying pressure, and reached a new ATH.
WBT Price Overview
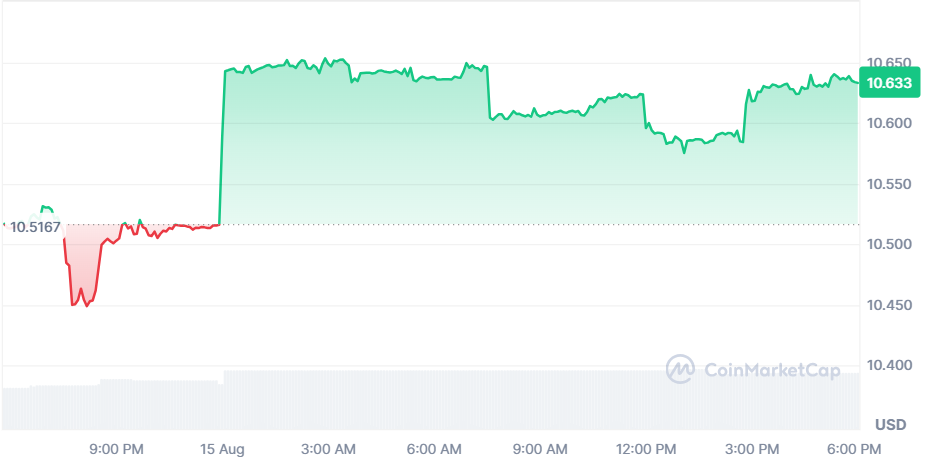
WhiteBIT Coin crypto was being traded at $10.71 at press time, it was neutral over the past 24 hours. The market capitalization was $921.15 Million and the 24-hour trading volume was $9.36 Million at the time of writing.
Technical Analysis of WBT Over 4-H Timeframe
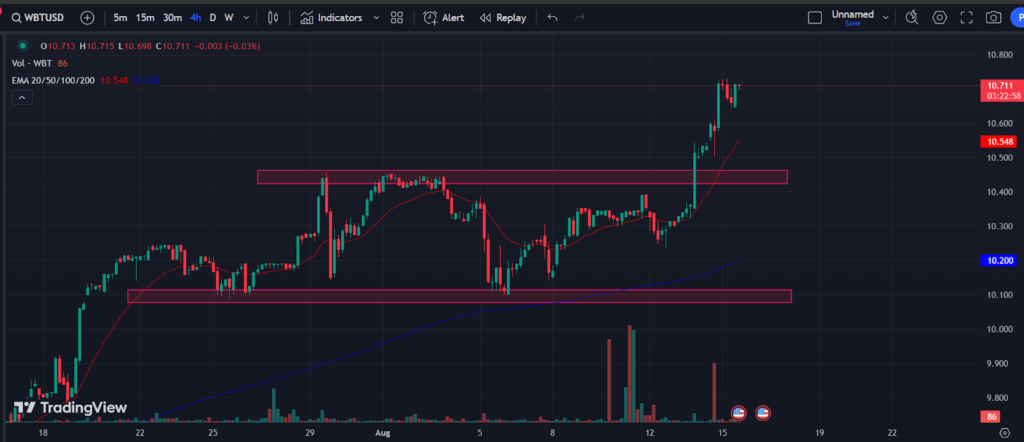
In a 4-H time frame, the WhiteBIT Coin price broke out from a parallel channel. The breakout might invite buyers for a strong bullish move. The price has triggered a pullback and a bullish move is expected soon.
On the other hand, if the digital asset price drops back to the parallel channel, it will turn into a fake breakout. The fake breakout would trap buyers and witness a sharp selling. Defending the 200-day EMA would be the last hope for the buyers to remain strong in the battle.
WBT Price Surpassed the $10 Mark; Will the Momentum Sustain?
WBT has surpassed the major resistance level of $10. The crypto defended this level and formed 2 bullish morubozu candlesticks back to back.
If the trading volume supports this momentum, WBT may surge further. Alternatively, if the price slips below the $10 mark, then sellers may become confident. Below this level, profit booking could be seen on a higher scale.
According to the technical indicators, the MACH produced a golden crossover with the signal line and the histograms have flipped to green. The technical indicators are giving a bullish forecast.
WBT Price Analysis and Forecast
Considering the strong bullish trend in the WBT price, the breakout from the $10 mark, and the support level flipping to $10, it seems the WhiteBIT Coin price could potentially continue its upward movement. However, there is a possibility of profit booking if the price slips below the $10 mark. The technical indicators are supporting a bullish forecast, but it’s important to keep an eye on the trading volume to confirm the momentum.
Technical Levels
The WhiteBIT Coin price is expected to face resistance from the $10.70 mark and an imaginary resistance level of $12. It may take support at the $10.00 and $9.25 levels.
Disclaimer
This article is for informational purposes only and provides no financial, investment, or other advice. The author or any people mentioned in this article are not responsible for any financial loss that may occur from investing in or trading. Please do your research before making any financial decisions.




