
 streamoors
 IGNITION
 Sword Inu
 no crying in the casino
 Altai the Tiger
 Pearl
Pearl Pudgy Penguins
- The Chainlink token price advanced by 72% in the last 1 year.
- LINK token price outperformed 56% of the top 100 crypto assets in the last 1 year.
The Chainlink (LINK) price advanced by 2.4% in the last 24 hours from the press time. This was followed by an advance of 38% in the token’s traded volume. The following data showed a huge rise in token demand among traders and investors.
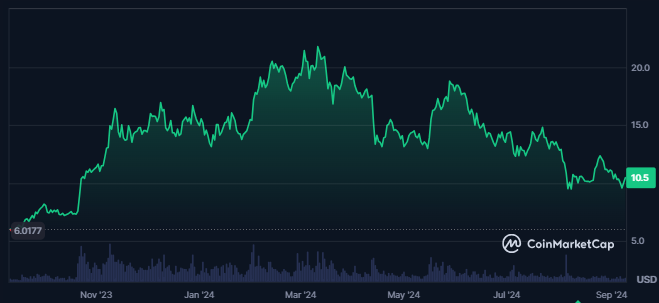
At press time, the Chainlink crypto was the 14th largest cryptocurrency in the global crypto market. This resulted in a market cap value of $6.353B at press time, following a market cap dominance of 0.32%. It showed a strong market presence in the token.
The supply inflation of the Chainlink coin was 13.01%, which was certainly high. The LINK price was also highly volatile, resulting in 6.24%. It might lead to uncertain spikes in the token price.
The token’s price sentiment was bearish, as per Coincodex, and its price traded at 8200% above its all-time low price. The all-time low price further was achieved seven years ago.
As of this writing, the LINK coin price traded at $10.48, and the token has 721.8K holders. Also, the token’s top 10 holders held 31.09% of the total supply.
What Does Derivatives Data Indicate For Chainlink Token?
The Chainlink token’s derivatives traded volume increased 61% in the last 24 hours. This resulted in a traded value of $295.11M.
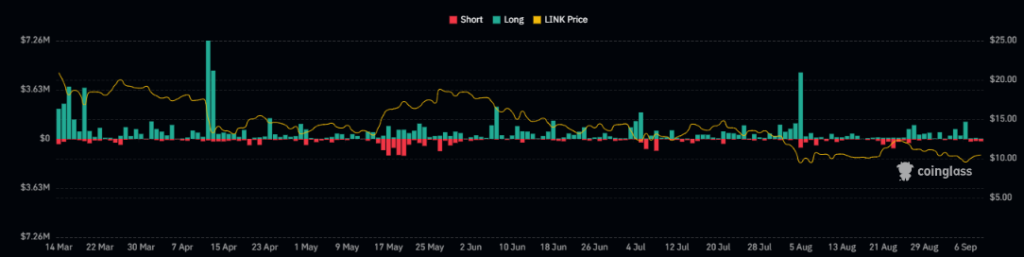
The token’s open interest also advanced by 2.8% in the last 24 hours. This showed traders’ good engagement with the token’s derivatives.
Higher shorts worth $232.97K were also liquidated in the last 24 hours. Against this, longs worth $83.15K were liquidated, showing the bulls’ dominance in the LINK price.
Where Is The LINK Token Price Heading Toward On The Technical Chart?
The daily chart of the Chainlink crypto revealed a strong lower-low pattern. It was accompanied by the price recently breaking below a key support zone.
This breakdown has resulted in forming a descending triangle pattern coupled with a dynamic resistance level. It played a critical role in the LINK’s price movement.
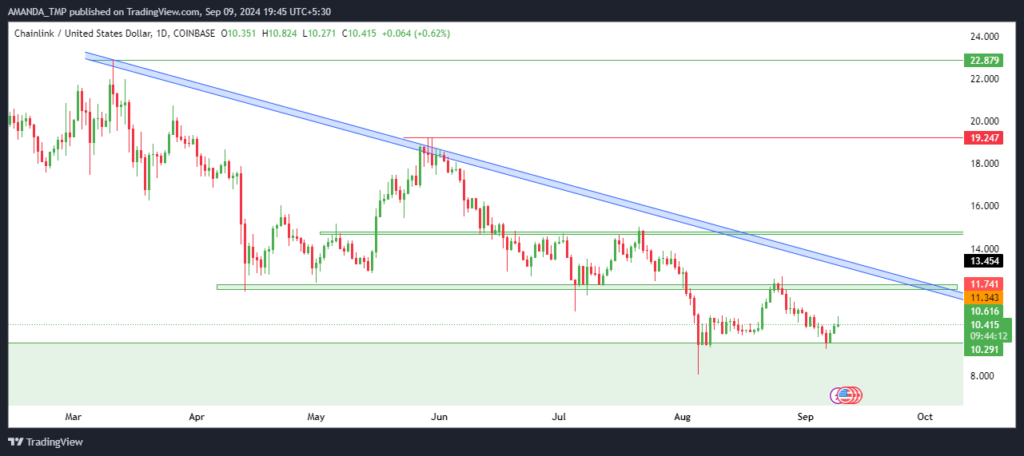
Approximately a year ago, LINK was trading within a prolonged consolidation phase before breaking out to reach higher levels.
This breakout marked a significant upward move. It took the token out of its consolidation zone and into a new trading range.
LINK coin price has returned to the breakout level, facing renewed downward pressure. However, suppose the token forms a bullish pattern and breaks above the dynamic trendline. It could signal the beginning of a strong uptrend.
This potential breakout would provide a more positive outlook for LINK’s future price action.
Technical Indicators of the Chainlink Also Exhibit a Bearish Outlook
The Chainlink crypto has experienced a prolonged price decline, falling below the average true range of the Supertrend indicator. It has consistently traded below the 50-day and 200-day EMAs, indicating persistent bearish momentum.
LINK/USD Chart by TradingView
Recently, a death cross occurred between the two EMAs, further amplifying the negative sentiment around the token. The MACD and signal lines have also remained in negative territory following a death cross. It underscored the strong dominance of sellers in the market.
Additionally, the RSI recently dipped into the oversold zone, crossing below the 14-day SMA. It introduced volatility and uncertainty into the token’s price action. This suggested that the market could still experience fluctuations in the near term.
If the Chainlink crypto continues its downward trajectory, it may find support at the $5.70 and $9.50 levels. On the upside, resistance is expected at $19.20 and $22.80 should the token attempt a recovery.
Disclaimer
This article is for informational purposes only and does not provide any financial, investment, or other advice. The author or any people mentioned in this article are not responsible for any financial loss that may occur from investing in or trading. Please do your research before making any financial decisions.




