
 Sword Inu
 no crying in the casino
 streamoors
 IGNITION
 Altai the Tiger
 Pearl
Pearl Quantus
- The Bittensor token price outperformed 90% of the top 100 crypto assets in the last 1 year.
- The TAO token price traded in green for 15 days in the last 30 days.
In recent days, the Bittensor (TAO) price has faced a decline in a crucial support zone. A firm profit booking over the last few months accompanied this decline.
However, the TAO price rebounded by a 6.5% increase in the last 24 hours. It reached a market cap value of $2.048B. Due to the market cap increase, as per CoinMarketCap, the token secured the rank of 39. This indicated its strong market presence, followed by a market cap dominance of 0.10%.
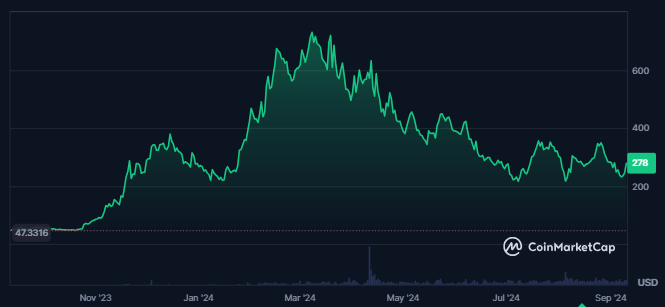
TAO Price Up 800% From ATL But Down 63% From ATH
With a surge in market cap, the TAO crypto traded volume advanced by 23%, resulting in a traded value of $69.215M. This led to medium liquidity as the token’s volume/market cap ratio was 3.4%.
Bittensor had only 35% of its total supply in circulation, followed by a fully diluted market cap of $5.839B. The token price traded is 800% above its all-time low price, formed a year ago. Despite this, the TAO price was down by 63% from its all-time high price of $767.68.
The TAO price was highly volatile, resulting in 10.55%, which might lead to uncertain spikes in the token price in the future. The token’s sentiment was bearish, and the fear and greed index was 33. This indicated fear among token’s investors.
What Do the Bittensor Token Derivatives Indicate About the Trend?
Bittensor token witnessed a higher short liquidation of $76.24K in the last 24 hours from the press time. Against this, longs worth $24.32K were liquidated, showing sellers’ dominance in the token price.
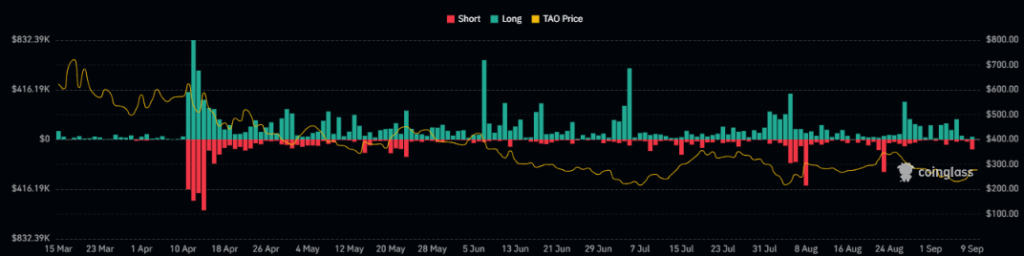
The TAO crypto’s liquidation chart showed higher long liquidation over the last few weeks. This led to a price decline to particular lows.
The token’s derivatives volume increased 36% in the last 24 hours. It resulted in a traded value of $116.24M, showing traders strong engagement in the token.
Following the surge in derivatives volume, the open interest also advanced by 3.9%, leading to a rise in the token’s open positions. A value of $56.08M followed this, and the token’s long/short ratio was 0.9763.
TAO Token Price Continues To Consolidate Inside A Small Range
The TAO crypto has faced a prolonged decline, adhering to a falling wedge pattern that has resulted in a significant loss of value. Throughout this downtrend, the token has plummeted by more than 70% from its swing high of $756.87. It reflected the severity of its bearish movement.
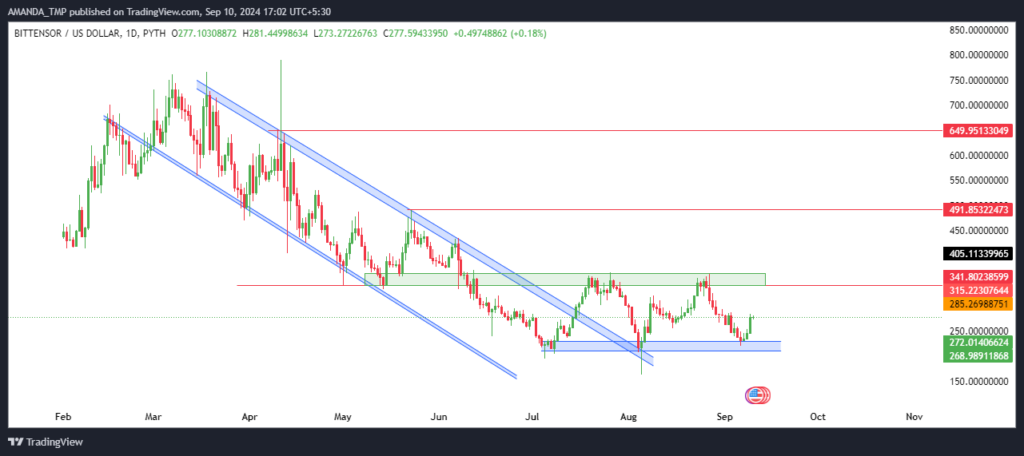
Over the past year, the TAO token has exhibited notable volatility. A strong uptrend and a sharp, sustained downtrend characterized it.
However, a shift in momentum has recently been observed. This happened because the TAO price broke out above the falling wedge pattern.
This breakout has been supported by strong bullish candlesticks over the past few days, indicating renewed buying interest.
Suppose the TAO crypto continues to rise and surpass its most recent swing high. It could signal the continuation of this upward trend. Such a move would potentially lead to higher price levels. It could offer a more optimistic outlook for the token’s performance in the coming period.
Bittensor Token’s Technical Continues To Follow Bearish Setups
The 50-day and 200-day EMAs recently formed a death cross, signaling a bearish trend in the market. Following this crossover, the TAO price declined sharply, trading consistently below both EMAs and reinforcing the strong downtrend.
TAO/USD Chart by TradingView.com
Meanwhile, the MACD and signal line have been moving bullishly. Their overlap has introduced significant volatility into the price action. This overlap indicates uncertainty in market sentiment, as momentum fluctuates between bullish and bearish conditions.
Additionally, the RSI dropped below the 50 level, currently sitting at 49, suggesting weakening buying pressure. This was further compounded by a decline below the 14-day SMA on the daily chart, signaling potential continued downward movement in the near term.
The support levels for the TAO crypto were $163.0 and $228.0, followed by the resistance levels of $490.0 and $650.0.
Disclaimer
This article is for informational purposes only and does not provide any financial, investment, or other advice. The author or any people mentioned in this article are not responsible for any financial loss that may occur from investing in or trading. Please do your research before making any financial decisions.




