
 streamoors
 Altai the Tiger
 Sword Inu
 IGNITION
 no crying in the casino
 Quantus
 NEAR Protocol
- The Graph token price increased by 87% in the last 1 year.
- In the last 30 days, the GRT token price traded green for 15 days.
The Graph (GRT) has broken free from the long-standing downtrend. The GRT price has pushed past all key resistance levels and is now catching the eyes of investors. After following a strong downtrend, this recent breakout has hinted toward a potential rally.
Join us as we analyze the token’s recent price movements, market dynamics, and key financial data. Let’s find out what targets the GRT price could achieve.
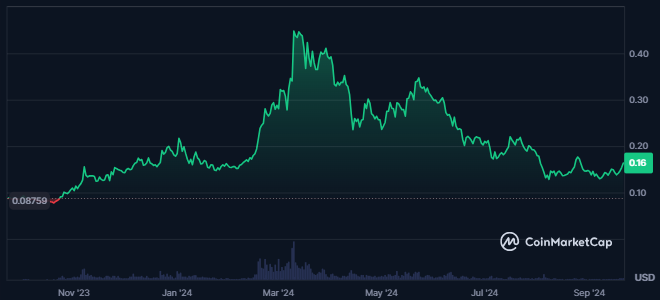
GRT Price Sees Volatility Amid Market Cap Growth
The market capitalization of GRT crypto stood at $1.564 Billion. It marked a 2.84% increase in the last 24 hours. This growth positioned GRT as the 50th largest cryptocurrency globally, reflecting its significant standing within the crypto ecosystem.
Despite this rise, the GRT price has exhibited high volatility, with a 9.62% fluctuation rate. The token also shows medium supply inflation, at 3.49%, contributing to a dynamic market environment. GRT’s market cap dominance is currently 0.07%, underscoring its strong presence in the crypto space.
Interestingly, while the market cap surged, the traded volume for The Graph token declined by 23%. Despite its market growth, this drop indicates a waning demand for the token among investors and traders.
Additionally, the token’s liquidity remained low at 2.81%, which may pose challenges for larger trades. GRT’s circulating supply is 9.548 billion, with a maximum supply limit of 10.799 billion tokens. These metrics suggested potential room for future growth but highlighted the need for careful market monitoring.
What Does the Financial Data of the Graph Token Indicate?
The Graph token currently has 165,000 holders, with 38% of them in profit, accounting for 62,390 addresses. Despite this positive outcome for some, many holders remain at a loss.
Specifically, 91,220 addresses, or 56.49% of the total, are classified as “out of the money.” This reflected the challenging market conditions for these investors.
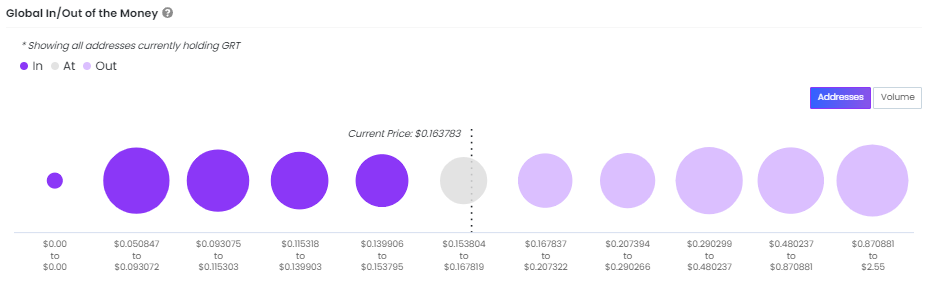
The concentration of GRT supply was notably high among the largest holders. The top 10 holders control 58.20% of the total supply, with the largest individual holder possessing 2.854 billion GRT.
This was equivalent to 28.54% of the circulating supply. This concentration highlighted these key players’ potential influence on the token’s price and market behavior.
Moreover, large holders dominate the ownership structure, with 83% of the total supply held by major investors. Additionally, 66% of all GRT holders have held their tokens for over one year. This signaled long-term confidence in the asset despite short-term fluctuations.
GRT Price Breaks Above A Long-Term Declining Trendline
In recent days, GRT crypto has experienced a surge in buying activity, reflected in a significant price increase. However, after reaching a swing high of $0.4963, the token began to encounter profit-taking. This selling pressure led to a notable 65% decline in the trading price from its peak.
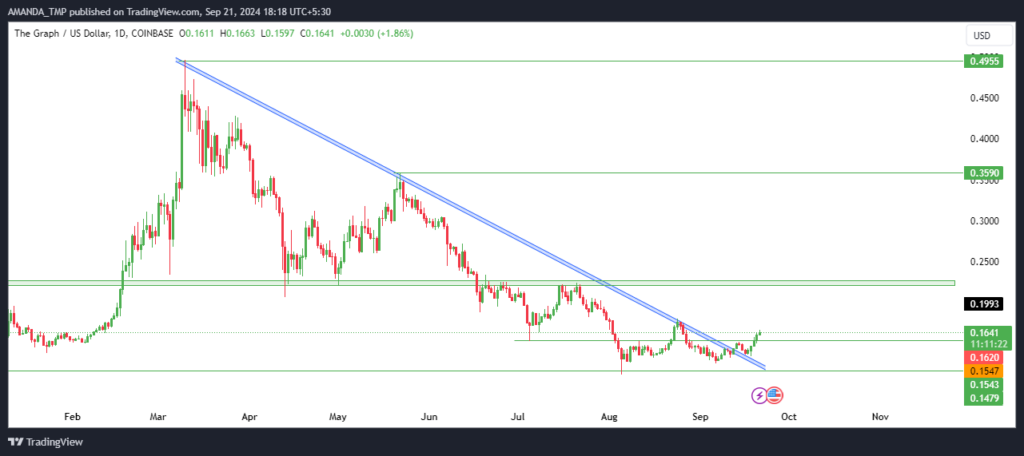
A dynamic trendline emerged as the GRT price continued to drop, marking a market sentiment shift. This shift also brought about a strong change in the token’s character. It signaled a potential move toward a bullish outlook.
Recently, GRT broke above the dynamic trendline, accompanied by a consistent upward movement in its price. This breakout indicated a possible trend reversal, suggesting that the token may return to bullish territory.
Are Technicals Of The Graph Token Reversing From The Lows?
The Graph price has advanced above the 50-day and 200-day EMAs while the EMAs traded in a death cross. This exhibited an uncertain character in the price of the token.
GRT/USD Chart by TradingView.com
The MACD line advanced from the lower levels and broke above the median. This resulted in a bullish crossover. However, the signal line was still trading in a negative trajectory.
The RSI also advanced to 62.2, breaking above the 14-day SMA. This signaled a rise in the token’s bullish momentum.
The GRT price might take support at $0.110 and $0.130, followed by the resistance levels of $0.350 and $0.490.
Disclaimer
This article is for informational purposes only and does not provide any financial, investment, or other advice. The author or any people mentioned in this article are not responsible for any financial loss that may occur from investing in or trading. Please do your research before making any financial decisions.




