
 Altai the Tiger
 IGNITION
 streamoors
 NEAR Protocol
 Sui
Sui Ethereum
 Pudgy Penguins
- BEAM price has dragged below the trendline support zone of $0.01600.
- Technical indicators and on-chain metrics turned bearish and suggest a down move ahead.
BEAM price decreased massively by over 14% intraday and faced bearish pressure over the past three days. It struggled to cross the 200-day EMA cluster and faced a sharp pullback.
Notably, the BEAM crypto price has fallen below the key EMAs, which signals further potential decline.
On Thursday, Oct 3, BEAM crypto saw a significant 14% decline and noted a three-day bearish streak. This week, the BEAM token has undergone a substantial retracement from $0.02000 to $0.01500, signaling seller dominance.
BEAM Price Faces Bearish Pressure: Market Sentiment Analysis
This week, BEAM crypto experienced a bearish move and turned back from the resistance zone of $0.0200. Notably, a fakeout and bull trap activity were noted.
Over the last three days, the BEAM price has corrected by more than 25% and has displayed a selloff. The rejection from the 200-day EMA level and slipping below the trendline support of $0.01500 further emphasize the downtrend.
BEAM price was trading at $0.01502 at press time, noting an intraday change of -13.90%. It boasted a market cap of $774.90 Million and has a volume-to-market cap ratio of 0.0433.
A tweet by @ER404i on X highlighted that the BEAM price has exited the channel. It could trigger a follow-up move in the following sessions.
The Relative Strength Index (RSI) is trending toward the oversold territory, currently around 43. This indicated increased selling pressure. If the RSI drops below 30, it could lead to an extended selloff.
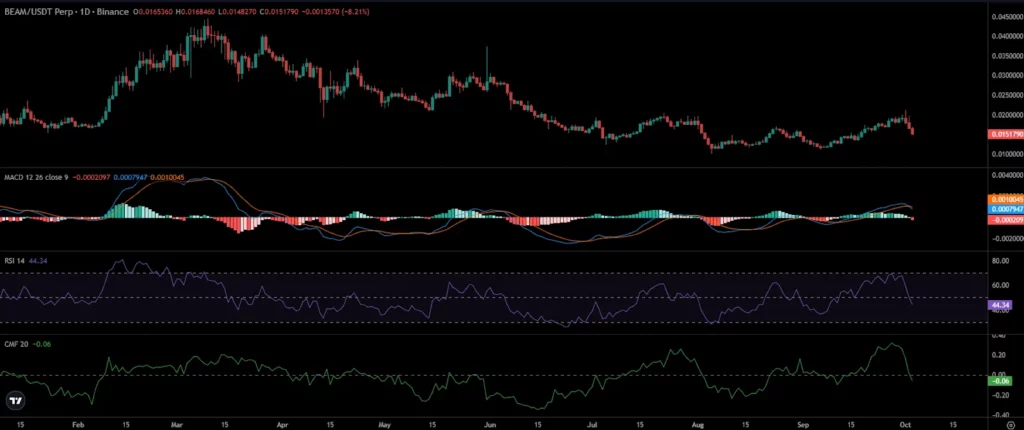
Consequently, the MACD histogram also began to trend in the bearish direction, conveying signs of bearishness. Similarly, the Chaikin Money Flow (CMF) indicator reading at -0.03 represents a liquidity exit from the market.
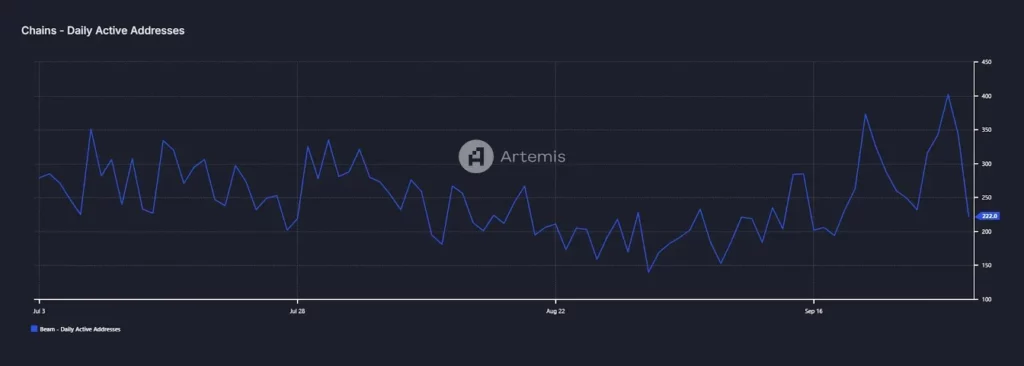
Likewise, the Daily Active Addresses (DAA) noted a massive decline, slipping over 110% in the last three days. This conveyed that investors have lost interest in the altcoin. BEAM’s DAA is currently noted to be around 222 at press time.
Futures Market Data Represent a Bearish Outlook
Notably, the OI-weighted funding rate data reflected a bearish bias. The intraday session goes negative at around 0.0395%, implying a demand for short positions.
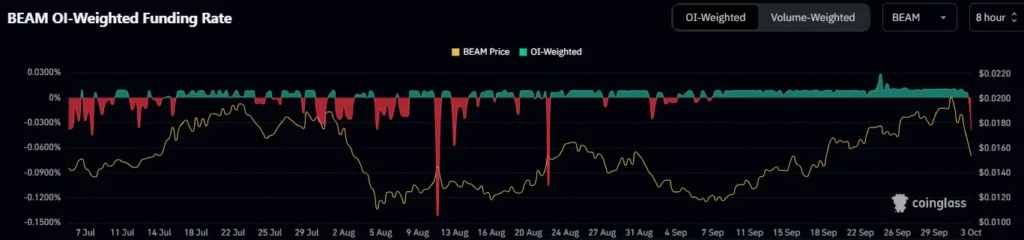
Similarly, the Open Interest (OI) dropped alongside the price decline, a sign of long unwinding. Over the past 24 hours, the OI shed over 5.40% to $10.30 Million.
Indeed, the BEAM price has encountered the 23.6% Fib support zone and anticipates a rebound. If the altcoin price reverted from the region, it might retest the 20-day EMA shortly.
A breakdown below the current support at $0.01450 could lead to further declines toward the next significant support at $0.012000.
On the upside, the resistance to watch is $0.01800. Reclaiming this level could indicate a potential reversal, and a close above $0.02000 would confirm the double-bottom breakout.
Disclaimer
This article is for informational purposes only and does not provide any financial, investment, or other advice. The author or any people mentioned in this article are not responsible for any financial loss that may occur from investing in or trading. Please do your research before making any financial decisions.




